Mountain Climbing Customer Evaluation and Feedback Donut Chart
RJ0600060_14
- Last Update 07/06/2025
- File Size 1MB
- # of Slides 2
- File Format PPTX
- Slide Ratio 16:9
- Color
Keywords
- #Content-Based Slides
- #Design-Based Slides
- #Market and Competitor Analysis
- #Customer Success Stories
- #Graph
- #Customer Analysis
- #Customer Testimonials and Feedback
- #Circles
- #Doughnut Chart
- #16:9
- #doughnut chart PowerPoint
- #donut chart slide template
- #pie chart comparison
- #percentage data visualization
- #customer feedback chart
- #gender analysis presentation
About the Product
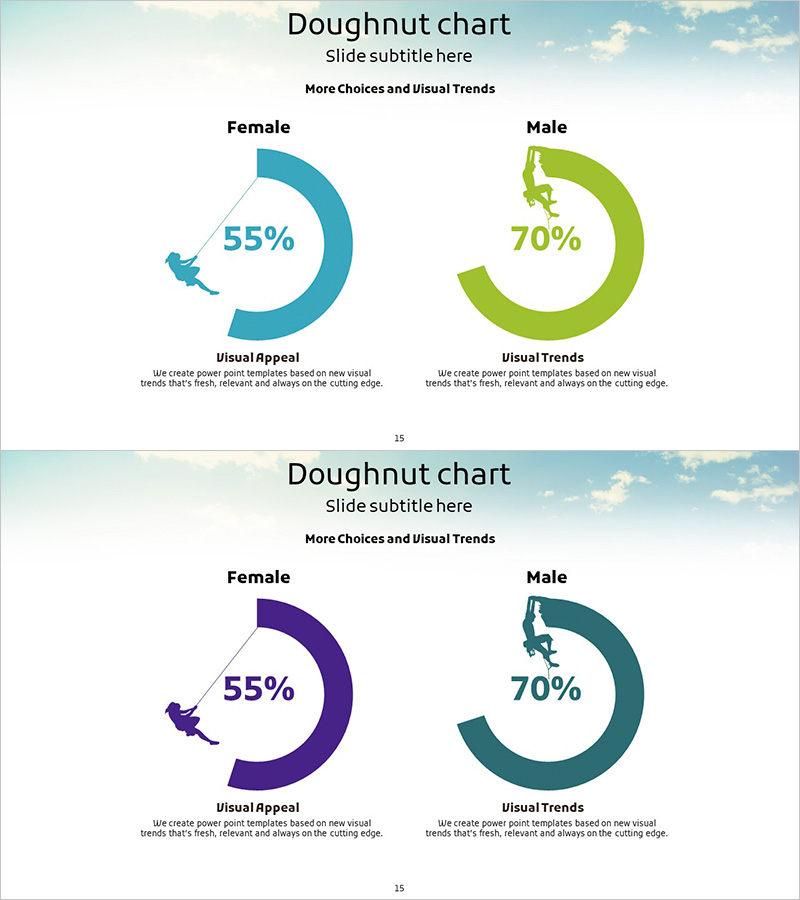
A doughnut chart PowerPoint slide designed to visualize customer evaluation and feedback by gender. This 2-slide set displays dual percentage data such as Female 55% and Male 70% side by side. The doughnut charts use teal and lime green color coding, with percentage values prominently displayed in the center and category icons on the left for intuitive differentiation. Ideal for market analysis, customer satisfaction surveys, and gender preference comparison presentations. Ready-to-edit PPTX format for immediate use.
Usage Points
-
Main Usage
Optimized for comparing two percentage datasets simultaneously, such as customer ratings, market analysis, and gender preferences. The center space of each doughnut chart emphasizes key metrics to focus audience attention.
-
How to Use
Edit the chart colors, percentage values, and left-side icons to match your data. The 2-slide structure allows sequential presentation of multiple comparison items. Optimized for 16:9 widescreen display format.
-
Recommended For
Marketing professionals, market research analysts, HR managers, and sales directors presenting customer satisfaction scores, demographic analysis, and preference survey results.
-
Slide Structure
2-slide set. Each slide contains 2 doughnut charts (left and right layout), title area above charts, and description text field below. Single-series data representation per chart, percentage values insertable in center, category icons on left for differentiation.
Related Products
-

Customer Evaluation and Feedback on Renewable Energy Business - Doughnut Chart
#Market and Competitor Analysis #Customer Success Stories #Graph
-

Percentage Visualization with Donut Charts
#Market and Competitor Analysis #Customer Success Stories #Graph
-

Donut Chart by Gender in Old Age – Customer Analysis and Feedback
#Market and Competitor Analysis #Customer Success Stories #Graph
-

Market Share Donut Pie Chart & Silhouette – Unique Design and Information Delivery
#Market and Competitor Analysis #Graph #Other
