Comparison Table of Food Categories and Core Ingredients – Emphasizing Key Financial Indicators
RB0700013-1_6
- Last Update 03/16/2025
- File Size 2.1MB
- # of Slides 2
- File Format PPTX
- Slide Ratio 4:3
- Color
Keywords
- #Content-Based Slides
- #Design-Based Slides
- #Business Strategy
- #Financial Plans and Performance
- #Diagram
- #Production Plan
- #Key Financial Indicators
- #Table
- #Standard Table
- #4:3
- #comparison table PowerPoint slide
- #horizontal data table template
- #financial metrics presentation
- #data visualization slide
- #business report template
About the Product
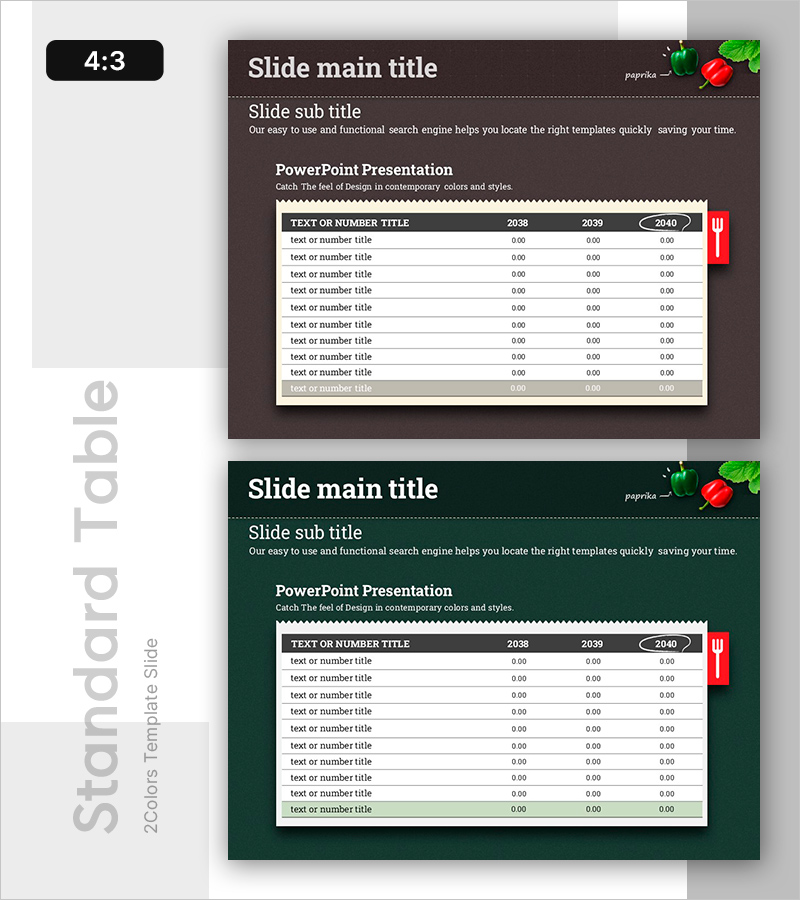
A data-focused PowerPoint slide featuring a white comparison table on a dark brown background. The horizontal table structure displays 10 items across three years (2038, 2039, 2040), enabling clear numerical comparison and trend analysis. A red accent bar on the right side with paprika illustration provides visual emphasis, making it ideal for financial reports, performance analysis, and business presentations. Two-slide set includes dark brown and forest green background versions for flexible document styling.
Usage Points
-
Main Usage
Presents numerical data in a structured table format for side-by-side comparison across multiple periods or categories. Ideal for displaying financial indicators, sales performance, quarterly results, market analysis, and KPI tracking with clear visual hierarchy and emphasis on key metrics.
-
How to Use
Input item names and year-by-year figures into table cells, then use the red accent bar to highlight critical data points. Apply to financial reports, quarterly reviews, investor presentations, executive briefings, and performance dashboards. Select background color matching your document theme for visual consistency.
-
Recommended For
Finance teams, business analysts, sales departments, and marketing professionals presenting quantitative data. Suitable for business plans, quarterly reports, performance analysis, market research findings, budget planning, sales comparisons, and any data-driven presentation requiring structured numerical display.
-
Slide Structure
10-row by 3-column table layout with header row (Item Name, 2038, 2039, 2040) and nine data entry rows. Red accent bar with numerical icon positioned on the right for emphasis. Available in two background versions: dark brown and forest green for flexible document integration.
Related Products
-

Curved Theme Purple Template Diagram – Key to Financial Planning
#Financial Plans and Performance #Diagram #Capital Requirements
-

Budget Table for Financial Analysis – Concise and Clear Data Presentation
#Financial Plans and Performance #Diagram #Budget
-

Triangular Pattern Presentation Template Pie Chart – Market Analysis and Strategy
#Market and Competitor Analysis #Financial Plans and Performance #Diagram
-

Orange Hexagon Presentation Template Table – Visualization of Revenue and Profit
#Financial Plans and Performance #Diagram #Sales and Revenue
