Changing Perceptions about Parental Support – Market Trend Analysis
RB0700010_5
- Last Update 03/15/2025
- File Size 0.5MB
- # of Slides 2
- File Format PPTX
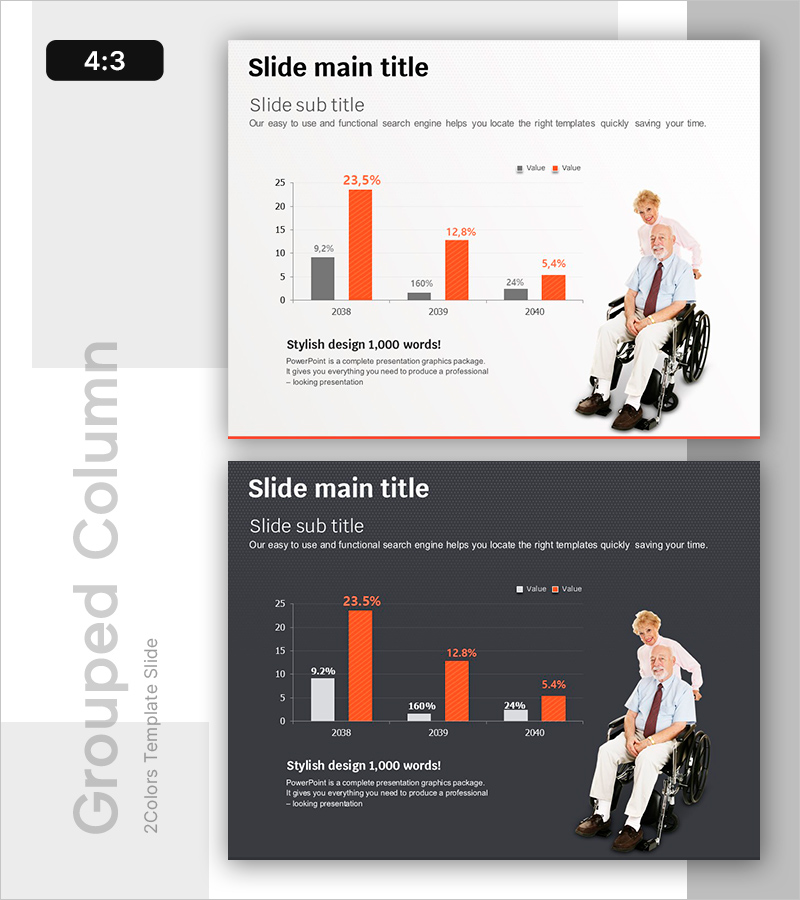
- Slide Ratio 4:3
- Color
Keywords
About the Product
A grouped bar chart PowerPoint slide visualizing changing perceptions about parental support across three years (2038–2040). The slide uses two data series represented in gray and orange bars to clearly compare year-over-year trends. Percentage values are displayed directly above each bar for precise data communication, while a real-world image on the right adds human context. Formatted in 4:3 aspect ratio with 2 slides, this template is ready to use for market trend analysis, customer perception surveys, social statistics presentations, and business reports.
Usage Points
-
Main Usage
Simultaneously compare two data series across multiple time periods to highlight trends and differences. Ideal for presenting parental support perception shifts, market dynamics, customer satisfaction metrics, and other time-series data. Percentage labels ensure accurate statistical information is emphasized.
-
How to Use
Insert this slide into marketing plans, business reports, market research presentations, and customer analysis documents when explaining year-over-year comparative data. Customize the gray and orange colors to match your corporate brand, and freely edit the values and category labels to fit your data.
-
Recommended For
Marketing professionals, market analysts, business executives, customer research specialists, and statisticians preparing data-driven presentations. Particularly effective when emphasizing year-over-year change trends and comparative performance metrics.
-
Slide Structure
Slide 1: Title area + 3 categories (2038, 2039, 2040) with 2 data series (gray, orange) in grouped bar format + percentage value labels + legend + right-aligned photograph. Slide 2: Dark background with identical layout. 4:3 aspect ratio, 2-slide PPTX format.
Related Products
-

User Rating Analysis Chart – Visualizing Customer Insights
#Market and Competitor Analysis #Diagram #Graph
-

Target Analysis Subdivided Vertical Bar Graph – Harmonizing Blue and Green
#Market and Competitor Analysis #Graph #Customer Analysis
-

Marketing Performance Analysis Chart by Year – Visualizing Market Trends
#Market and Competitor Analysis #Diagram #Graph
-

Body Fat Change After Running – Market Analysis
#Market and Competitor Analysis #Graph #Customer Analysis
