Camping Business Trend Graph – Future and Vision
RB0600020_4
- Last Update 03/14/2025
- File Size 2.1MB
- # of Slides 2
- File Format PPTX
- Slide Ratio 4:3
- Color
Keywords
- #Content-Based Slides
- #Design-Based Slides
- #Market and Competitor Analysis
- #Graph
- #Customer Analysis
- #Future Outlook
- #Industry Trends
- #Column
- #Segmented Column
- #4:3
- #vertical bar chart PowerPoint
- #camping business trend slide
- #market analysis presentation
- #stacked bar chart template
- #data visualization slides
About the Product
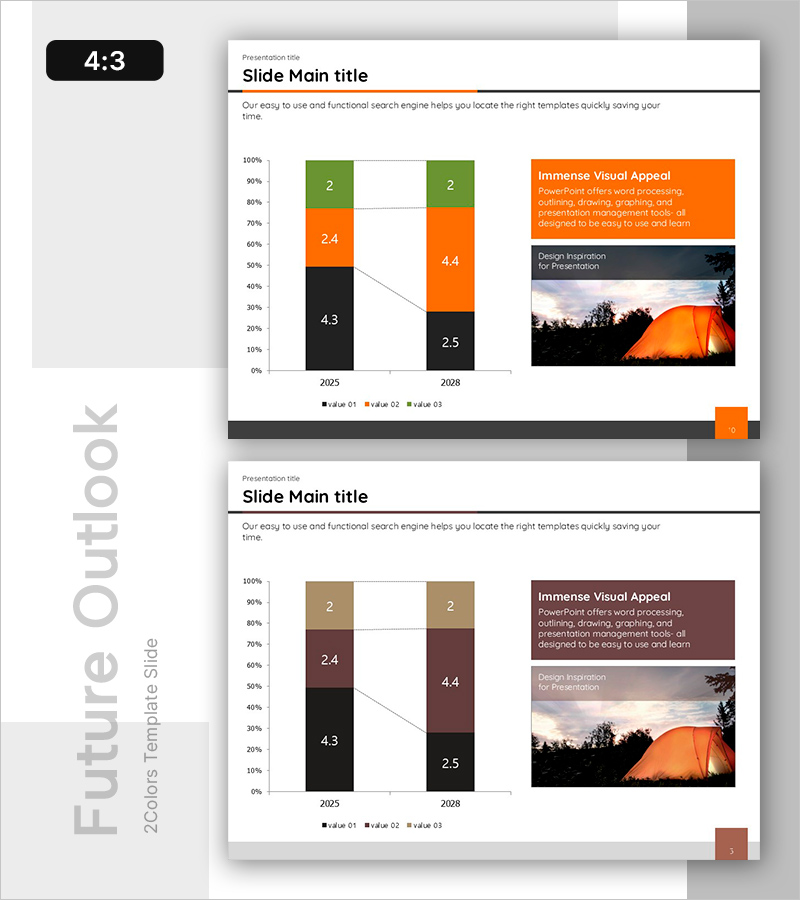
A vertical bar chart PowerPoint slide visualizing camping business market trends across two time periods. The slide features a three-series stacked bar chart (black, orange, green) comparing 2025 and 2028 data with clearly labeled numerical values on each segment. The right side includes an orange text box for key messaging and an image area for visual context. This design is ideal for market analysis presentations, business plans, investor pitch decks, and strategic planning documents. Provided in 4:3 aspect ratio PPTX format for seamless integration into your presentation workflow.
Usage Points
-
Main Usage
Clearly communicate camping industry market size changes and future outlook using data-driven visualization. The vertical bar chart enables intuitive year-over-year and series-by-series comparison, while the right-side text box and image area emphasize key insights and strategic vision.
-
How to Use
Deploy this slide in the market analysis section to illustrate camping sector growth trajectory. Use bar heights and color differentiation to highlight data variations at a glance, and populate the right panel with critical insights or forward-looking statements to maximize presentation impact.
-
Recommended For
Ideal for business plans, investor pitch decks, market research reports, and marketing strategy presentations in the camping and outdoor recreation industry. Recommended for business development teams, marketing professionals, and investor relations specialists presenting to stakeholders.
-
Slide Structure
2-slide set. First slide contains title and descriptive text. Second slide features a 3-series stacked vertical bar chart (value 01, value 02, value 03) comparing 2025 and 2028 data, with an orange text box on the right for messaging and an image placeholder for visual enhancement.
Related Products
-

Segmented Vertical Bar Graph Blue Yellow – Customer Analysis and Market Trends
#Market and Competitor Analysis #Graph #Customer Analysis
-

Change Graph by Business Item – Market Trend Analysis
#Business Strategy #Market and Competitor Analysis #Graph
-

Visualization of Learning Response Data – Market Trend Analysis
#Market and Competitor Analysis #Graph #Future Outlook
-

Market Growth Chart for Business Insights
#Market and Competitor Analysis #Diagram #Graph
