Standard Blood Sugar Table by Year
RB0700009_5
- Last Update 03/15/2025
- File Size 1MB
- # of Slides 2
- File Format PPTX
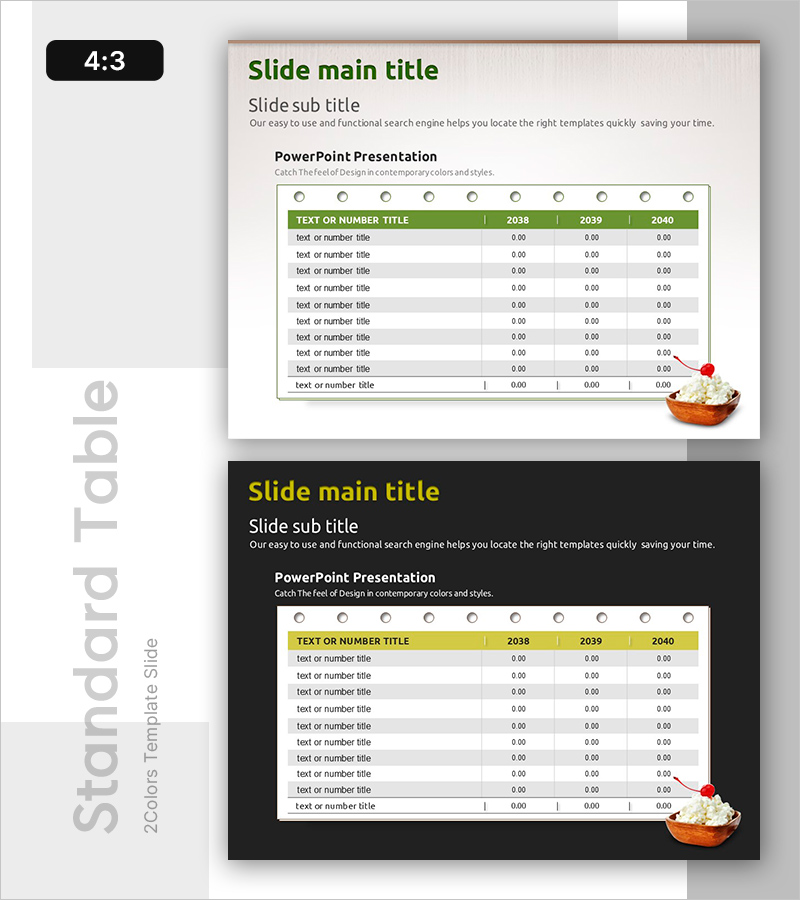
- Slide Ratio 4:3
- Color
Keywords
About the Product
A professional data table PowerPoint slide designed for organizing and comparing year-over-year numerical information. This horizontal table structure features 10 data rows and 3 year columns (2038, 2039, 2040), enabling quick visual analysis of trends and changes. The green header row and light gray cell backgrounds create clear information hierarchy, while circular icons and red accent points highlight key metrics. Formatted in 4:3 aspect ratio with 2 slides, this PowerPoint template is ready to use in business reports, market analysis presentations, financial reviews, and quarterly performance briefings.
Usage Points
-
Main Usage
The primary purpose is to organize and compare quantitative data across years, items, or categories in a structured table format. Ideal for presenting business performance metrics, market statistics, financial reports, sales figures, and other numerical information with maximum clarity and visual impact.
-
How to Use
Simply replace the placeholder text 'text or number title' with your actual item names and numerical values in the corresponding cells. Year columns (2038, 2039, 2040) can be customized to quarters, months, regions, or other time periods. Cell background colors and text formatting can be adjusted to match your corporate branding guidelines.
-
Recommended For
Recommended for business reports, quarterly performance presentations, market analysis documents, financial statements, sales statistics, customer satisfaction surveys, competitive analysis, executive briefings, investor presentations, and internal meetings. Particularly effective for data-driven presentations requiring clear numerical comparisons.
-
Slide Structure
Horizontal table with 10 data rows and 4 columns (item name plus 3 year columns). Green header row with white text provides visual distinction, while light gray data cells ensure readability. Circular icons on the left and red accent points on the right emphasize important metrics. Includes 2 customizable slides in 4:3 format.
Related Products
-

Industrial Data Report for Market Analysis Slides
#Market and Competitor Analysis #Diagram #Graph
-

Table Template for Data Summary – Efficient Planning
#Market and Competitor Analysis #Diagram #Market Status
-

Usage Analysis Graph – Visualizing Market Status
#Market and Competitor Analysis #Diagram #Graph
-

Green Analysis Chart for Market Overview – Effective Data Comparison
#Market and Competitor Analysis #Diagram #Graph
