Green Analysis Chart for Market Overview – Effective Data Comparison
RJ0600087_10
- Last Update 07/13/2025
- File Size 3.5MB
- # of Slides 2
- File Format PPTX
- Slide Ratio 16:9
- Color
Keywords
- #Content-Based Slides
- #Design-Based Slides
- #Market and Competitor Analysis
- #Diagram
- #Graph
- #Market Status
- #Market Analysis
- #Table
- #Line
- #Standard Table
- #Line Chart
- #16:9
- #dual line chart PowerPoint
- #data comparison slide template
- #market analysis chart
- #trend analysis PPT
- #line graph template download
About the Product
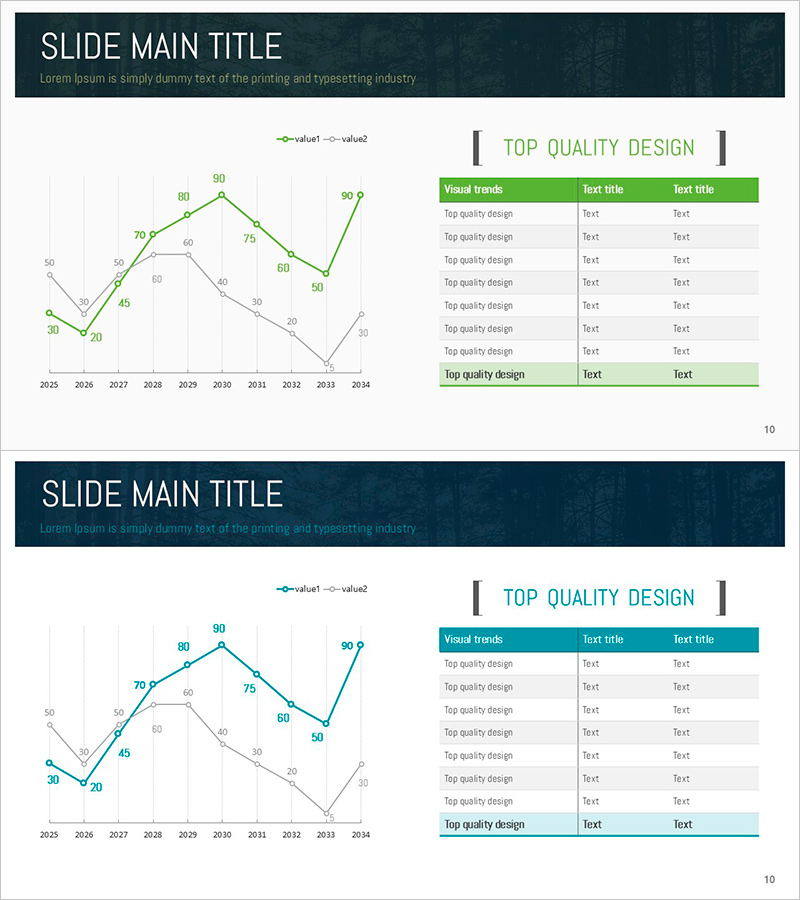
A professional dual-line chart PowerPoint slide optimized for market analysis and performance comparison. This presentation template visualizes two data series in green and gray across a 10-year timeline from 2025 to 2034, with precise numerical labels at each data point. The right side features an editable table section for key metrics and insights, while the dark header and white grid background create a corporate aesthetic. The 2-slide set accommodates various analytical scenarios and is ready for immediate customization and presentation use.
Usage Points
-
Main Usage
Simultaneously compare two data series over time to reveal trends, correlations, and performance gaps. Effectively communicate market conditions, revenue trends, KPIs, and comparative metrics by overlaying green and gray lines for clear visual distinction.
-
How to Use
Input your actual data into the left chart area to auto-update the line visualization, then populate the right table with analysis findings, key insights, and comparative conclusions. Customize the header title and subtitle to match your presentation topic, then insert into your deck.
-
Recommended For
Executive reports, business performance presentations, market analysis briefs, financial updates, marketing ROI analysis, and consulting proposals. Ideal for managers, analysts, strategists, and marketing professionals who need to present quantitative comparisons with credibility.
-
Slide Structure
2-slide layout with dark header section (title and subtitle), left-aligned dual-line chart (10-year span 2025–2034, 2 data series with value labels), and right-aligned table (header row + 6 data rows + footer row). Green accent and gray secondary colors establish visual hierarchy.
Related Products
-

Yellow Red Line Charts and Tables – Market Status Analysis
#Market and Competitor Analysis #Diagram #Graph
-

Usage Analysis Graph – Visualizing Market Status
#Market and Competitor Analysis #Diagram #Graph
-

Business Analysis Line Graph – Visualizing Market Trends
#Market and Competitor Analysis #Graph #Market Status
-

Business Status Chart – Presentation Template for Market Analysis
#Market and Competitor Analysis #Diagram #Graph
