Characteristic Diagram by Growth Process – Customer Analysis and Service Introduction
RB0700005_7
- Last Update 03/15/2025
- File Size 2.9MB
- # of Slides 2
- File Format PPTX
- Slide Ratio 4:3
- Color
Keywords
- #Content-Based Slides
- #Design-Based Slides
- #Product/Service Introduction
- #Market and Competitor Analysis
- #Diagram
- #Other
- #Features
- #Customer Analysis
- #Flow
- #Linear Flow
- #4:3
- #linear diagram PowerPoint
- #growth stage slide template
- #customer analysis diagram
- #5-step process PowerPoint
- #arrow diagram slide design
About the Product
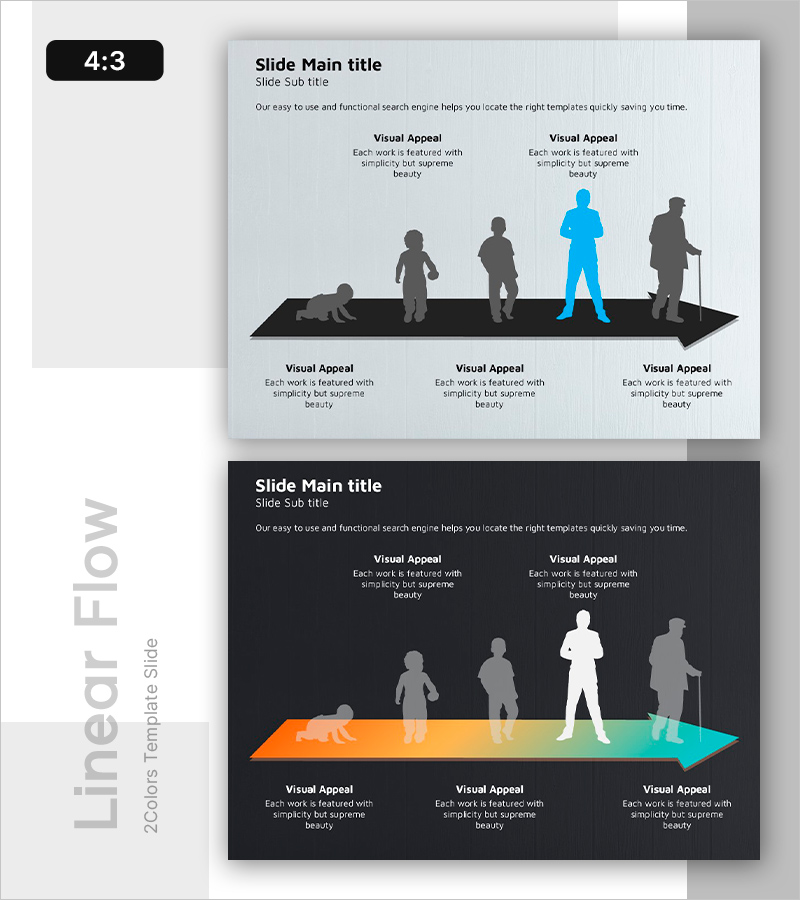
A PowerPoint slide that visualizes customer characteristics across five growth stages using a linear arrow progression. Set against a light gray background, the design features a black arrow with silhouette figures positioned along its length, with a blue accent element highlighting the key stage. Each stage has a clearly defined description area, making it immediately applicable for customer analysis, market analysis, and product introduction presentations. The 4:3 aspect ratio with 2-slide composition allows you to explain growth processes step-by-step aligned with your presentation flow.
Usage Points
-
Main Usage
Explains customer or product growth stages sequentially over time. Clearly visualizes characteristics and changes at each stage to enhance audience comprehension. Ideal for marketing strategies, customer journey mapping, product development roadmaps, and any presentation requiring linear progression visualization.
-
How to Use
Input stage-specific customer characteristics, behaviors, and purchase intent into the silhouette figures and text areas along the arrow. Add key messages or statistics to the 'Visual Appeal' sections below to strengthen persuasiveness. Adjust the blue accent element position to flexibly highlight important stages.
-
Recommended For
Marketing managers, sales strategists, product managers, consultants, and educators presenting customer analysis, market segmentation, product roadmaps, and organizational growth strategies. Suitable for B2B proposals, business plans, marketing strategies, and training materials.
-
Slide Structure
Light gray background 4:3 aspect ratio with 2 slides. Title and subtitle area at top, center features black arrow with 5 silhouette figures (4 gray + 1 blue accent), bottom contains 5 'Visual Appeal' text boxes. Dark version with black background and orange-to-teal gradient arrow also included for flexible presentation styling.
Related Products
-

3 Analysis of the Elderly Slide – Insight-Centric Diagram
#Product/Service Introduction #Market and Competitor Analysis #Diagram
-

Running Silhouettes and Analytical Text – Dynamic Market Analysis
#Product/Service Introduction #Market and Competitor Analysis #Diagram
-

Customer and Service Analysis and Strategy – Data-Driven Approach
#Market and Competitor Analysis #Marketing Plan and Strategy #Diagram
-

Presentation Slides on the Elderly Living Alone – Customer Analysis and Market Overview
#Product/Service Introduction #Market and Competitor Analysis #Diagram
