Analysis Graph of Young and Old Age Groups – Market and Competitive Insights
RB0700005_5
- Last Update 03/15/2025
- File Size 3.2MB
- # of Slides 2
- File Format PPTX
- Slide Ratio 4:3
- Color
Keywords
- #Content-Based Slides
- #Design-Based Slides
- #Market and Competitor Analysis
- #Graph
- #Other
- #Market Analysis
- #Competitive Advantage
- #Line
- #Line Chart
- #Silhouette
- #4:3
- #line chart PowerPoint slide
- #demographic analysis presentation
- #age group comparison graph
- #market trend visualization
- #generational data PowerPoint template
About the Product
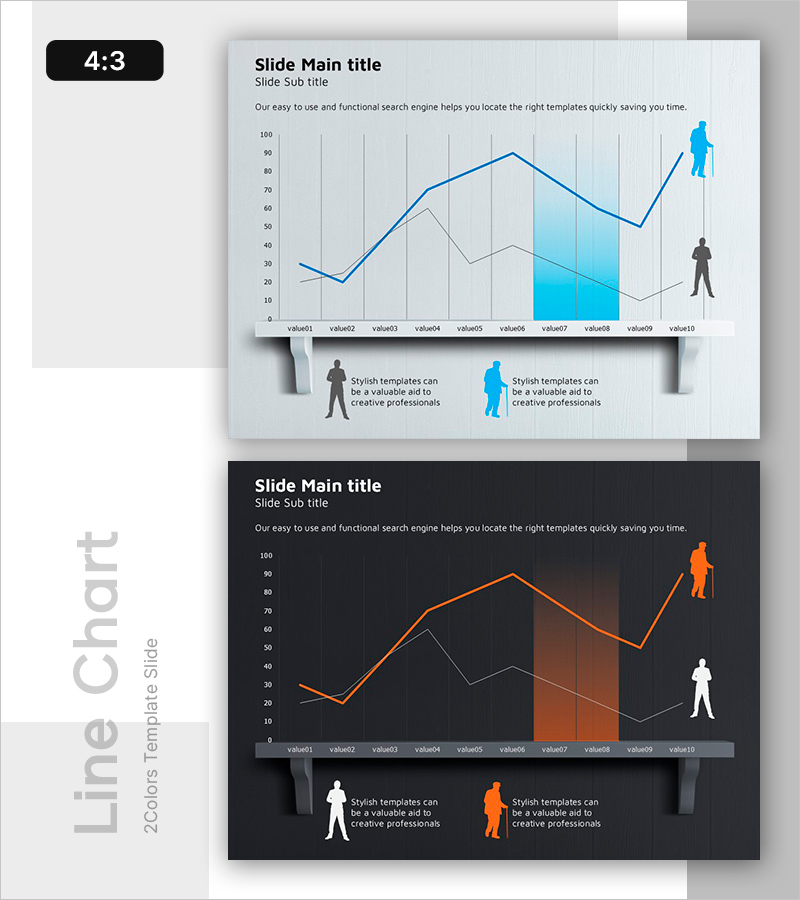
A 2-slide PowerPoint presentation visualizing market data across young and elderly age demographics. The slides feature dual-series line charts in blue and orange, tracking 10 data points to reveal generational trends and consumption patterns over time. Left and right silhouette icons clearly distinguish age groups, while light and dark background themes provide flexibility for different presentation contexts. Ideal for market analysis, competitive positioning, and customer segmentation presentations in business, finance, retail, and education sectors.
Usage Points
-
Main Usage
Visualize market trends across age groups using dual-series line charts to highlight generational differences in purchasing power, consumption patterns, and market share. Effectively communicate demographic insights for strategic decision-making and market positioning.
-
How to Use
Use in marketing strategy presentations, new market entry planning, and competitive analysis reports to explain generational consumer trends. Light-background slides suit standard conference rooms; dark-background slides work well for executive briefings and premium venues.
-
Recommended For
Marketing teams presenting market analysis, business development teams pitching new ventures, customer segmentation studies, and C-suite strategic planning. Particularly valuable for consumer goods, financial services, real estate, and education industries targeting specific age demographics.
-
Slide Structure
2-slide set with dual-series line charts (blue and orange), 10 data points per chart, left and right silhouette icons for age group distinction, bottom legend area, and light/dark background variants. 4:3 aspect ratio PPTX format with fully editable elements.
Related Products
-

Competitor Analysis Graph – Securing Market Advantage
#Market and Competitor Analysis #Graph #Market Analysis
-

Trend Visualization of Surgery for Market and Competitive Analysis
#Market and Competitor Analysis #Graph #Market Analysis
-

The Jumping Boys and Bell Charts - Data Visualization for Market Analysis
#Market and Competitor Analysis #Graph #Market Analysis
-

Forest Construction Graphs and Strategies – Sustainable Competitive Advantage
#Market and Competitor Analysis #Graph #Market Analysis
