Pig Family and Market Analysis Graph Slide
RJ0500026_24
- Last Update 06/14/2025
- File Size 0.4MB
- # of Slides 2
- File Format PPTX
- Slide Ratio 16:9
- Color
Keywords
About the Product
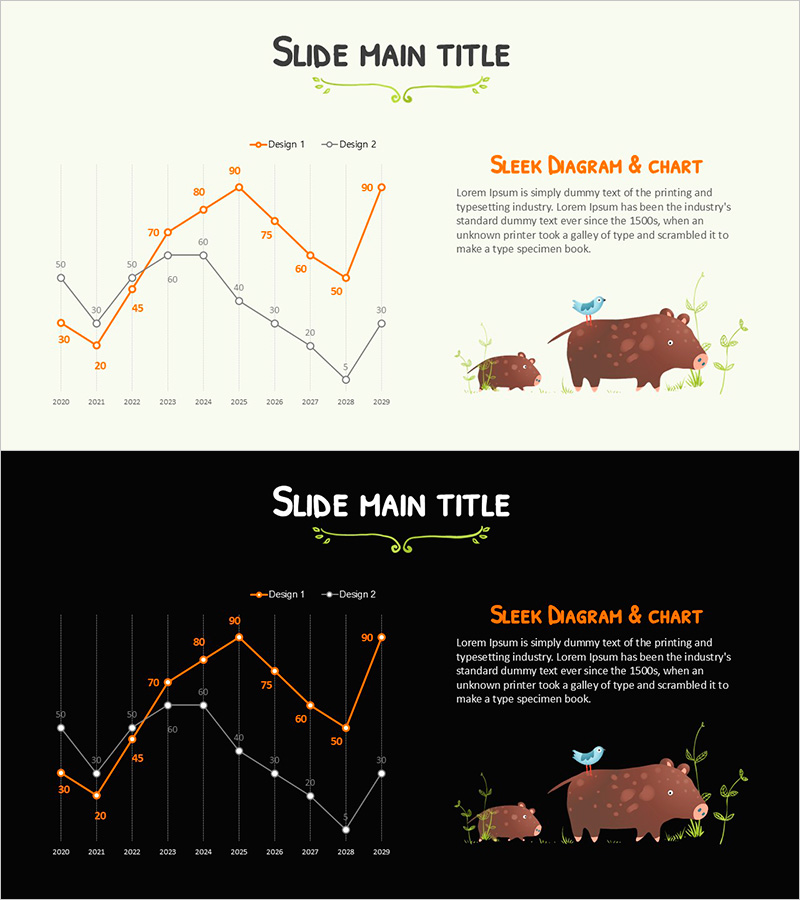
A PowerPoint slide featuring a dual-series line chart that visualizes market data trends over a 10-year period from 2010 to 2029. The orange and gray lines clearly distinguish between two data series, with numerical values displayed at each data point for precise comparative analysis. An illustrative element (pig family) is positioned on the right side to enhance thematic connection. Two versions are provided—light background and dark background—allowing you to select based on your presentation environment. Delivered as a 16:9 widescreen PPTX file ready for immediate editing.
Usage Points
-
Main Usage
Ideal for comparing and analyzing changes in two or more data series over time. Effectively visualizes market growth rates, competitive benchmarking, quarterly performance trends, customer satisfaction evolution, and other long-term data patterns in an intuitive manner.
-
How to Use
Open the slide and replace existing data points and numerical values with your actual data. Assign the orange line to your primary metric and the gray line to your comparison target. Update the legend and axis labels to match your presentation context. Select either the light or dark background version depending on your venue's lighting conditions.
-
Recommended For
Marketing professionals, financial analysts, business strategists, and consultants presenting executive reports, investor pitches, quarterly earnings presentations, and market analysis decks. Particularly effective for competitive advantage analysis and growth trajectory explanations.
-
Slide Structure
Each slide contains a title area, dual-series line chart spanning 2010–2029 with 10 data points, legend (Design 1 and Design 2), and an illustrative element on the right. The chart grid uses gray background lines for easy data reading, with numerical values clearly marked at each point.
Related Products
-

Competitor Analysis Graph – Securing Market Advantage
#Market and Competitor Analysis #Graph #Market Analysis
-

Line Chart of the Violence Survey – Market Analysis and Competitive Advantage
#Market and Competitor Analysis #Graph #Market Analysis
-

Analysis Graph of Young and Old Age Groups – Market and Competitive Insights
#Market and Competitor Analysis #Graph #Other
-

Line Chart for Visualizing Data Changes – Effective Information Delivery
#Market and Competitor Analysis #Graph #Market Analysis
