Donut Chart: Urban Energy Source Breakdown – Market Share Analysis
RB0700003_5
- Last Update 03/15/2025
- File Size 0.3MB
- # of Slides 2
- File Format PPTX
- Slide Ratio 4:3
- Color
Keywords
About the Product
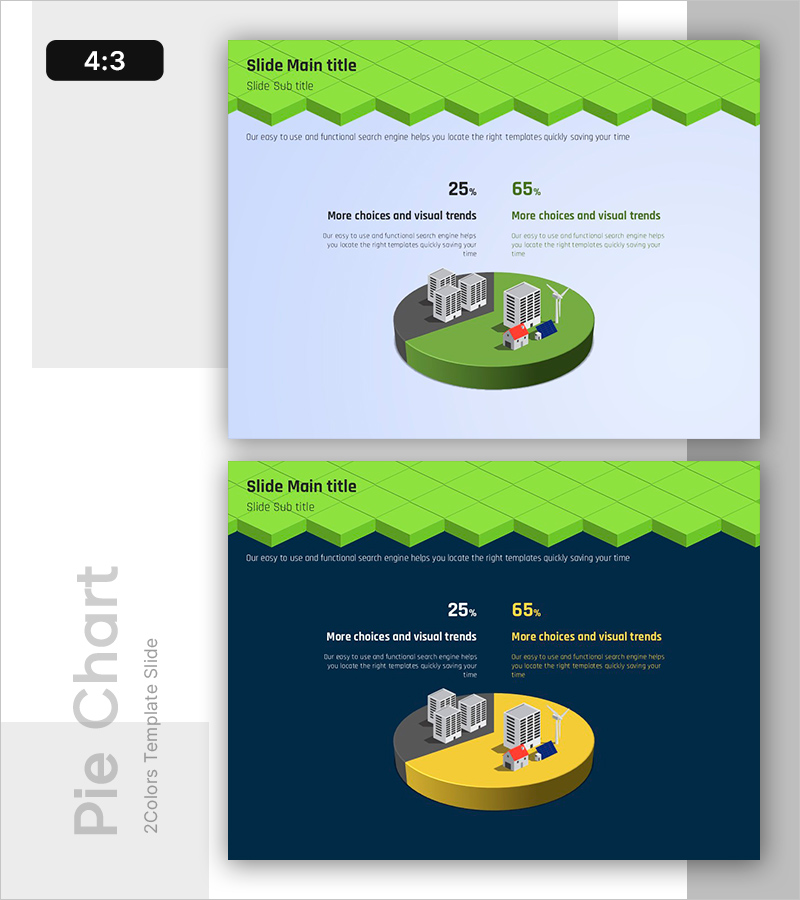
A donut chart PowerPoint slide template for visualizing energy source usage ratios and market share analysis. Available in two color schemes: lime green and dark navy backgrounds, each displaying 25% and 65% ratio data. Features 3D isometric building illustrations suitable for urban energy analysis, competitive advantage comparisons, and market share presentations. Provided in 4:3 aspect ratio PPTX format with fully editable text and data fields. Customize percentages and labels to represent various ratio datasets for business reports, marketing plans, and investment pitches.
Usage Points
-
Main Usage
Clearly visualize two-item ratio data such as energy source breakdown, market share distribution, and competitive comparison using donut chart format. Specific percentages like 25% and 65% are prominently displayed, while 3D isometric building graphics provide contextual relevance for urban, energy, and real estate presentations.
-
How to Use
Insert into business plans, marketing strategy documents, and investment pitch decks within market analysis sections. Use for competitor market share comparison, product feature adoption rates, energy consumption structure breakdown, and resource allocation visualization. Select lime green version for growth-oriented messaging or dark navy for trust and professionalism.
-
Recommended For
Energy, environmental, and real estate sector presenters; marketing and strategy professionals analyzing market data; sales and proposal teams explaining competitive positioning with numerical evidence. Two-color options allow tone matching to presentation context and audience expectations.
-
Slide Structure
Two-slide set. Each slide features a colored header with diagonal hexagon pattern (lime green or dark navy), light blue content area, centered donut chart with two segments, left and right percentage labels (25% and 65%), and bottom 3D isometric building illustration. Three editable text zones (title, subtitle, description) and two data fields for chart customization.
Related Products
-

Coffee Cup Pie Chart – Market Share Analysis
#Market and Competitor Analysis #Graph #Market Share
-

Investment Ratio Comparison – Market Share Analysis
#Market and Competitor Analysis #Graph #Market Share
-

Vegetable Competition Pie Chart – Market Share Analysis
#Market and Competitor Analysis #Graph #Market Share
-

Competitive Market Share Comparison – Visual Data Analysis
#Market and Competitor Analysis #Graph #Market Share
