Coffee Cup Pie Chart – Market Share Analysis
RJ0600003_8
- Last Update 06/22/2025
- File Size 5MB
- # of Slides 2
- File Format PPTX
- Slide Ratio 16:9
- Color
Keywords
About the Product
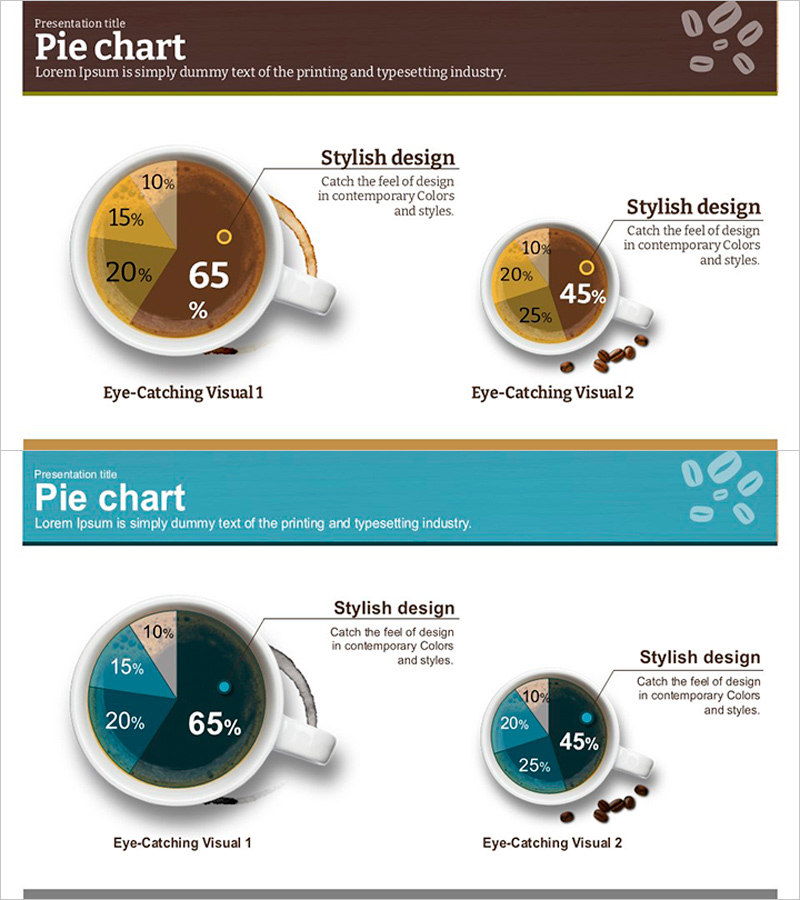
A visually engaging PowerPoint slide featuring 3D pie charts shaped like coffee cups to illustrate market share and competitive positioning. The design uses warm brown and golden tones with two chart variations: a large version (65% center value) and a smaller version (45% center value). Each pie chart is divided into four segments with percentage labels and accompanying text areas for detailed analysis. This presentation template is ready to use in business reports and pitch decks, enabling effective communication of data-driven insights and market analysis findings.
Usage Points
-
Main Usage
Visualize market share, sales distribution, customer composition, and budget allocation by displaying proportional data in pie chart format. The 3D coffee cup design adds visual impact and captures audience attention during presentations.
-
How to Use
Apply this slide in marketing strategy presentations, business performance reports, competitive analysis, and customer segmentation materials. Use the large chart to emphasize key metrics and the smaller chart for comparative analysis, enabling multi-layered information delivery.
-
Recommended For
Marketing managers, sales directors, business executives, management consultants, and data analysts presenting market conditions, sales performance, and customer distribution to stakeholders.
-
Slide Structure
Two-slide layout with two pie charts per slide (large and small versions). Each chart displays four segments with central percentage values (65%, 45%), segment-specific percentage labels (10%, 15%, 20%), and descriptive text areas positioned on the right side.
Related Products
-

Pie Chart Visualizing Coffee Ingredients Ratio - Market Share Analysis
#Market and Competitor Analysis #Graph #Market Share
-

Investment Ratio Comparison – Market Share Analysis
#Market and Competitor Analysis #Graph #Market Share
-

Donut Chart: Urban Energy Source Breakdown – Market Share Analysis
#Market and Competitor Analysis #Graph #Market Share
-

Competitive Market Share Comparison – Visual Data Analysis
#Market and Competitor Analysis #Graph #Market Share
