Pie Chart Visualizing Coffee Ingredients Ratio - Market Share Analysis
RJ0600075_7
- Last Update 07/10/2025
- File Size 3MB
- # of Slides 2
- File Format PPTX
- Slide Ratio 16:9
- Color
Keywords
About the Product
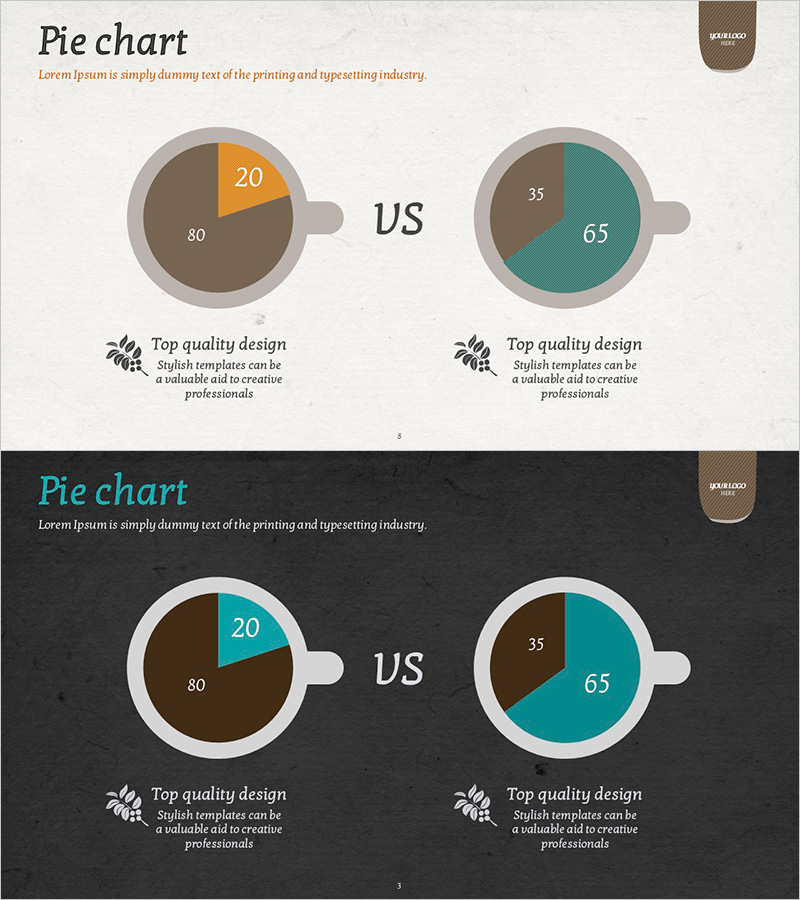
A PowerPoint slide featuring two pie charts that visually compare data ratios side by side. The two-tone color scheme of brown and teal creates clear contrast between two different scenarios, with each chart divided into 2 segments to represent market share, ingredient ratios, competitive advantage analysis, and other comparative data. The 16:9 widescreen format includes 2 slides ready for immediate editing and can be directly applied to presentations and reports.
Usage Points
-
Main Usage
Optimized for visualizing and comparing two data sets simultaneously by displaying their proportional segments. Ideal for presenting market share, product composition, customer distribution, budget allocation, and other segment-based ratio data with clarity.
-
How to Use
Double-click on the chart values and labels to edit them, and the chart will automatically update. Colors can be changed using the theme color palette, and chart size and position can be freely adjusted to fit your layout.
-
Recommended For
Recommended for marketing professionals, financial analysts, product managers, and sales presenters. Suitable for executive reports, quarterly performance analysis, competitive benchmarking, and customer segmentation presentations.
-
Slide Structure
2-slide set with 2 pie charts per slide. The left chart uses brown tones (80:20 split), while the right chart uses teal tones (65:35 split). Each chart includes a text description area below for additional context or labels.
Related Products
-

Coffee Cup Pie Chart – Market Share Analysis
#Market and Competitor Analysis #Graph #Market Share
-

Donut Chart: Urban Energy Source Breakdown – Market Share Analysis
#Market and Competitor Analysis #Graph #Market Share
-

Investment Ratio Comparison – Market Share Analysis
#Market and Competitor Analysis #Graph #Market Share
-

Vegetable Competition Pie Chart – Market Share Analysis
#Market and Competitor Analysis #Graph #Market Share
