Vegetable Competition Pie Chart – Market Share Analysis
RJ0600046_14
- Last Update 07/03/2025
- File Size 0.8MB
- # of Slides 2
- File Format PPTX
- Slide Ratio 16:9
- Color
Keywords
- #Content-Based Slides
- #Design-Based Slides
- #Market and Competitor Analysis
- #Graph
- #Market Share
- #Competitive Advantage
- #Circles
- #Pie Chart
- #16:9
- #pie chart PowerPoint slide
- #market share comparison
- #competitive analysis chart
- #2-segment pie chart
- #business presentation template
- #data visualization slide
About the Product
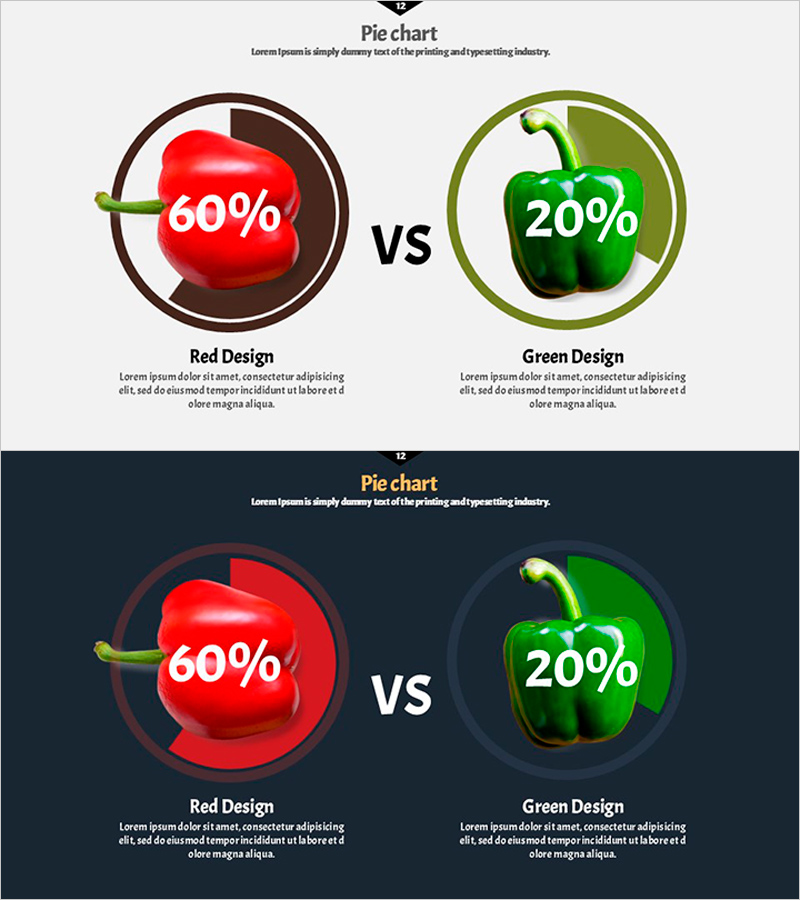
A PowerPoint slide featuring a 2-segment pie chart visualizing competitive dynamics in the vegetable market. The chart displays red bell pepper at 60% versus green bell pepper at 20% market share using 3D rendered shapes for intuitive comparison. Includes two design versions: one with a light gray background and another with a dark navy background, adapting to different presentation environments. Each pie segment clearly displays percentage values and labels for easy data interpretation, with circular border frames emphasizing the comparison. Fully editable PPTX format allows customization of colors, percentages, and text labels to match your specific market data.
Usage Points
-
Main Usage
Designed to clearly express market competition dynamics and share comparison through pie chart visualization. Ideal for competitive analysis, brand comparison, and market overview presentations in agriculture, food, and retail industries, while serving as an effective data-driven decision-making reference.
-
How to Use
Insert into the market analysis or competitive landscape section of your presentation to compare market share between two competing products or companies. Select the light background version for standard conference rooms or the dark background version for projector environments to maximize readability and visual impact.
-
Recommended For
Marketing professionals in food and agricultural companies, distribution and retail industry analysts, business executives preparing reports, market research presenters, management consultants, and sales professionals who need to communicate competitive positioning and market conditions persuasively.
-
Slide Structure
Two-slide set with the first slide featuring a light gray background displaying two 3D pie segments (red 60%, green 20%) positioned left and right with 'vs' text centered between them to indicate competition. The second slide presents the identical chart on a dark navy background for enhanced contrast. Each pie segment is enclosed in a circular border frame with percentage values displayed at the center of each segment.
Related Products
-

Coffee Cup Pie Chart – Market Share Analysis
#Market and Competitor Analysis #Graph #Market Share
-

Competitive Market Share Comparison – Visual Data Analysis
#Market and Competitor Analysis #Graph #Market Share
-

Investment Ratio Comparison – Market Share Analysis
#Market and Competitor Analysis #Graph #Market Share
-

Pie Chart Visualizing Coffee Ingredients Ratio - Market Share Analysis
#Market and Competitor Analysis #Graph #Market Share
