Regional Analysis of Green Building Adoption - Business Strategy
RB0700003_4
- Last Update 03/15/2025
- File Size 0.3MB
- # of Slides 2
- File Format PPTX
- Slide Ratio 4:3
- Color
Keywords
- #Content-Based Slides
- #Design-Based Slides
- #Business Strategy
- #Market and Competitor Analysis
- #Graph
- #Achievements
- #Market Analysis
- #Column
- #Column Chart
- #4:3
- #3D column chart PowerPoint
- #bar chart presentation slide
- #data comparison analysis
- #8-item chart template
- #business analysis PowerPoint
- #comparative data visualization slide
About the Product
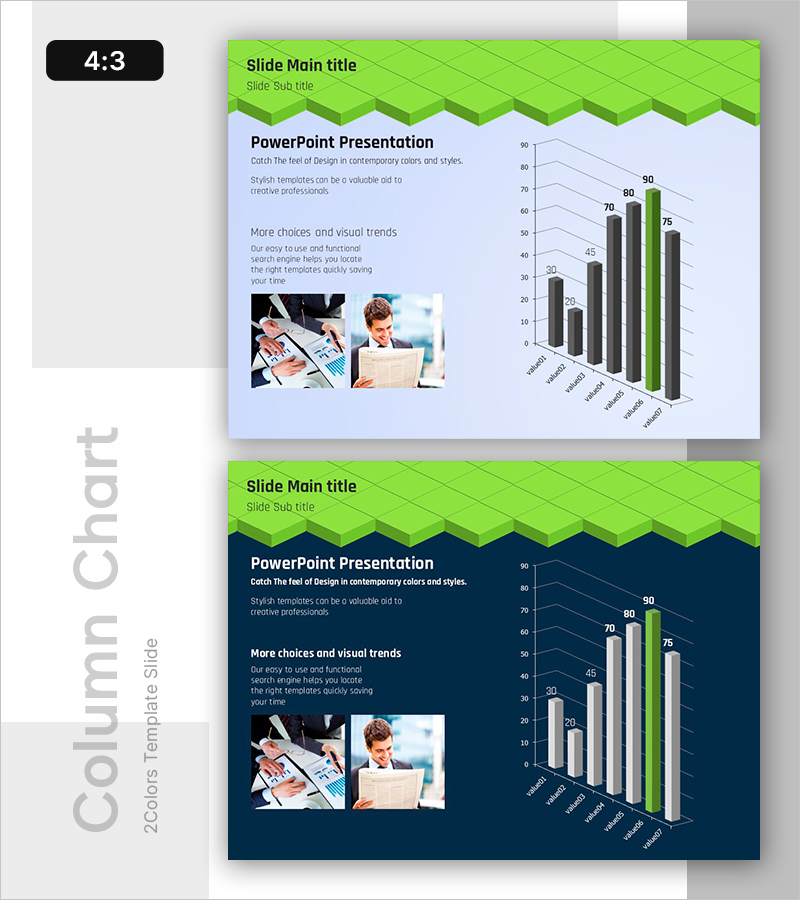
A 3D column chart PowerPoint slide featuring lime green accent color and dark gray background. This presentation template visualizes up to 8 data items for comparative analysis and business strategy presentations. The left section contains title, subtitle, description, and key points, while the right side displays a 3D column chart with lime green highlighting for the peak value. The three-dimensional bar design enhances data visibility and audience engagement. Ideal for business strategy presentations, regional adoption rate analysis, financial performance comparisons, and quantitative data-driven reports.
Usage Points
-
Main Usage
Visualize up to 8 quantitative data items using a 3D column chart for comparative analysis presentations. The lime green highlight bar draws attention to the peak value or key metric, making data insights immediately clear to your audience. Suitable for business strategy presentations, regional adoption rate analysis, financial performance reports, sales trend comparisons, and market analysis.
-
How to Use
Enter your slide title, subtitle, description, and key points in the left text area. Modify the 3D column chart data values to reflect your actual figures. Set the lime green highlight bar to emphasize the highest value or most important metric. Adjust background and text colors to match your corporate brand guidelines. All chart elements are fully editable in PowerPoint.
-
Recommended For
Executives, business managers, marketing teams, financial analysts, consultants, and researchers presenting quantitative data. Recommended for business plans, investor pitch decks, business performance reports, market analysis presentations, and departmental or regional performance comparisons.
-
Slide Structure
2-slide template with consistent layout. Each slide features a left text section (title, subtitle, description, bullet points) and a right 3D column chart (8 data items with one lime green accent bar). Designed in 4:3 aspect ratio for compatibility with standard projectors and displays.
Related Products
-

Visualizing Achievements through Design Innovation – Reflecting Latest Trends
#Business Strategy #Market and Competitor Analysis #Diagram
-

Analysis by Figures with Horizontal Bar Chart – Data-Driven Market Strategy
#Business Strategy #Market and Competitor Analysis #Graph
-

Business Performance Analysis Vertical Bar Graph – Performance and Strategy
#Business Strategy #Market and Competitor Analysis #Graph
-

Touch Wide Slide Template for Market Analysis with Vertical Column Chart
#Business Strategy #Market and Competitor Analysis #Graph
