Business Performance Analysis Vertical Bar Graph – Performance and Strategy
RM0500006_15
- Last Update 02/21/2025
- File Size 0.6MB
- # of Slides 2
- File Format PPTX
- Slide Ratio 16:9
- Color
Keywords
- #Content-Based Slides
- #Design-Based Slides
- #Business Strategy
- #Market and Competitor Analysis
- #Graph
- #Achievements
- #Market Analysis
- #Column
- #Column Chart
- #16:9
- #vertical bar chart PowerPoint
- #business performance analysis slide
- #bar graph template
- #performance comparison chart
- #business report presentation
About the Product
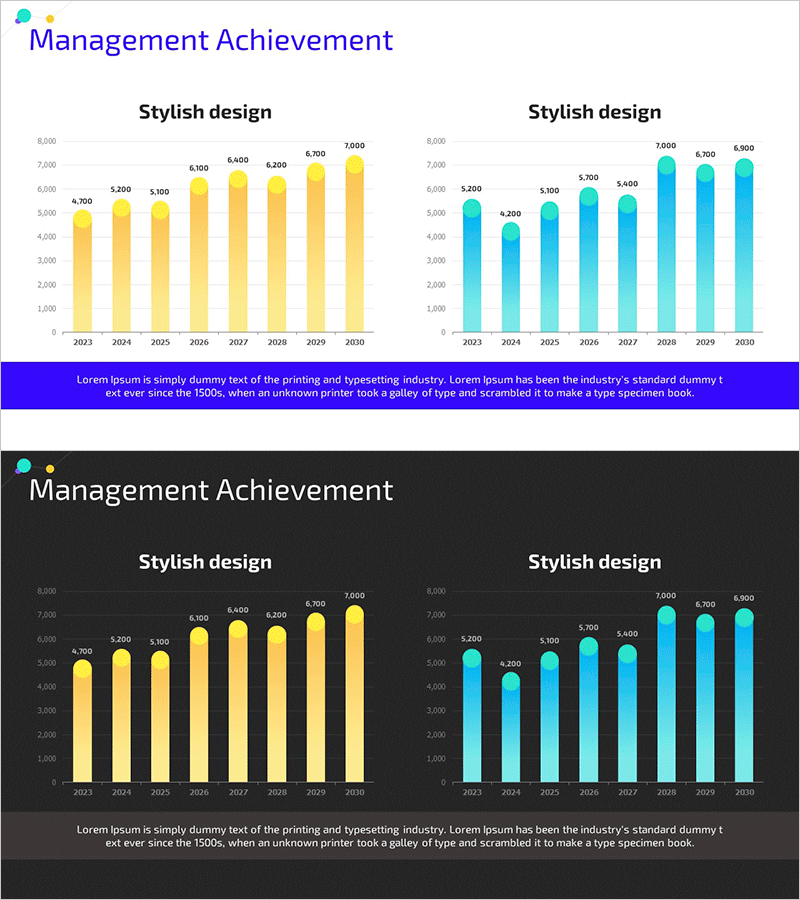
A vertical bar chart PowerPoint slide designed for business performance analysis and strategic reporting. This presentation template visualizes 8-year performance trends from 2023 to 2030 using two data series displayed side by side, making it ideal for executive presentations and quarterly business reviews. The design uses contrasting yellow and cyan color schemes to clearly distinguish between two performance metrics, with numerical labels displayed above each bar for precise data communication. The slide set includes 2 slides in 16:9 widescreen format, available in both light (white background) and dark (black background) versions for flexible presentation environments. All elements are fully editable in PowerPoint, allowing you to customize data values, colors, and labels to match your specific business analysis needs.
Usage Points
-
Main Usage
Clearly visualizes annual performance metrics, sales trends, and business results across multiple years. Enables side-by-side comparison of two key performance indicators to support executive decision-making in quarterly reviews, business strategy meetings, and performance presentations.
-
How to Use
Replace the bar heights and numerical labels with your actual performance data. Assign the yellow and cyan series to different metrics (such as target vs. actual, year-over-year comparison, or departmental performance), update the title and legend to match your presentation context, and select the background version that suits your presentation environment.
-
Recommended For
Executives, business managers, finance professionals, and marketing teams presenting quarterly or annual performance results, strategic reviews, and comparative analysis. Particularly effective for goal vs. actual performance, departmental achievements, regional sales performance, and any scenario requiring dual-series numerical comparison.
-
Slide Structure
Each slide features a title area, two vertical bar charts (yellow and cyan series), 8-year timeline axis (2023–2030), numerical data labels above each bar, and a legend. Two identical chart structures are positioned side by side for direct metric comparison, with an additional text area at the bottom for supplementary information or explanatory notes.
Related Products
-

Visualizing Achievements through Design Innovation – Reflecting Latest Trends
#Business Strategy #Market and Competitor Analysis #Diagram
-

Analysis by Figures with Horizontal Bar Chart – Data-Driven Market Strategy
#Business Strategy #Market and Competitor Analysis #Graph
-

Touch Wide Slide Template for Market Analysis with Vertical Column Chart
#Business Strategy #Market and Competitor Analysis #Graph
-

Regional Analysis of Green Building Adoption - Business Strategy
#Business Strategy #Market and Competitor Analysis #Graph
