Visualizing Achievements through Design Innovation – Reflecting Latest Trends
RM0800003_16
- Last Update 02/28/2025
- File Size 0.5MB
- # of Slides 2
- File Format PPTX
- Slide Ratio 16:9
- Color
Keywords
- #Content-Based Slides
- #Design-Based Slides
- #Business Strategy
- #Market and Competitor Analysis
- #Diagram
- #Graph
- #Achievements
- #Market Analysis
- #Cluster
- #Column
- #Inclusive Cluster Diagram
- #Column Chart
- #16:9
- #achievement visualization PowerPoint
- #bar chart presentation slide
- #business diagram template
- #data visualization slides
- #strategic presentation template
About the Product
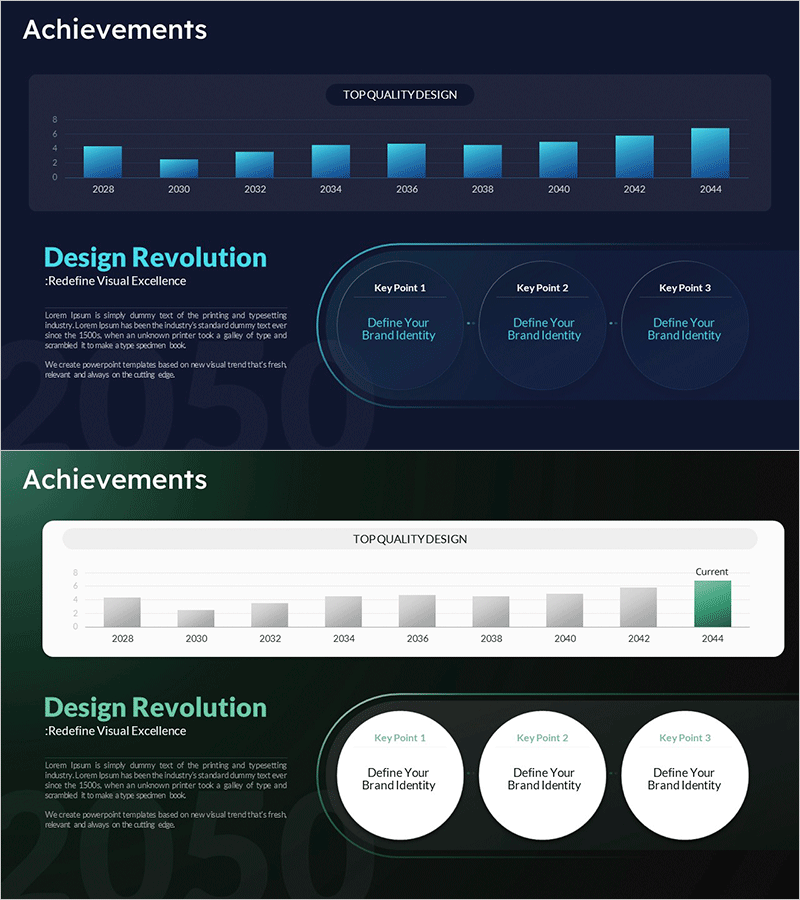
A 2-slide PowerPoint presentation set designed to communicate business achievements through visual storytelling. The first slide features a horizontal bar chart displaying year-over-year data trends from 2028 to 2044, while the second slide presents a circular diagram with three interconnected nodes highlighting key strategic points. Built on a dark navy background with cyan blue accent elements, this design conveys professionalism and clarity. Text and data areas are distinctly separated for easy readability during presentations. Provided in 16:9 widescreen PPTX format with fully editable components, allowing you to customize data values, messaging, and branding elements to match your specific presentation needs.
Usage Points
-
Main Usage
Simultaneously present quantitative performance metrics and qualitative strategic messaging. The bar chart effectively communicates numerical trends while the circular diagram emphasizes core brand identity, vision, and strategic pillars.
-
How to Use
Replace bar chart values with your actual performance data and update the three circular nodes with your key messages or strategic points. Customize background and accent colors to match your corporate branding, and adjust typography as needed for your presentation style.
-
Recommended For
Ideal for executive performance reports, quarterly business reviews, investor pitch decks, and annual strategic planning presentations. Suitable for marketing teams, sales departments, strategic planning units, and finance teams requiring data-driven communication.
-
Slide Structure
Slide 1: 'TOP QUALITY DESIGN' header with 9 horizontal bar chart elements spanning 2028–2044 timeline. Slide 2: Left section with 'Design Revolution' title and descriptive text; right section featuring 3 circular nodes (Key Point 1, 2, 3) connected by dotted lines. All elements optimized for 16:9 aspect ratio.
Related Products
-

Regional Analysis of Green Building Adoption - Business Strategy
#Business Strategy #Market and Competitor Analysis #Graph
-

Analysis by Figures with Horizontal Bar Chart – Data-Driven Market Strategy
#Business Strategy #Market and Competitor Analysis #Graph
-

Touch Wide Slide Template for Market Analysis with Vertical Column Chart
#Business Strategy #Market and Competitor Analysis #Graph
-

Business Performance Analysis Vertical Bar Graph – Performance and Strategy
#Business Strategy #Market and Competitor Analysis #Graph
