Nutrient Intake Distribution Pie Chart – Analysis of Dietary Composition
RB0700001_5
- Last Update 03/15/2025
- File Size 1MB
- # of Slides 2
- File Format PPTX
- Slide Ratio 4:3
- Color
Keywords
- #Content-Based Slides
- #Design-Based Slides
- #Product/Service Introduction
- #Market and Competitor Analysis
- #Graph
- #Composition
- #Market Share
- #Circles
- #Pie Chart
- #4:3
- #pie chart PowerPoint slide
- #4-segment pie chart template
- #ratio analysis presentation
- #expenditure breakdown chart
- #pie chart slide download
About the Product
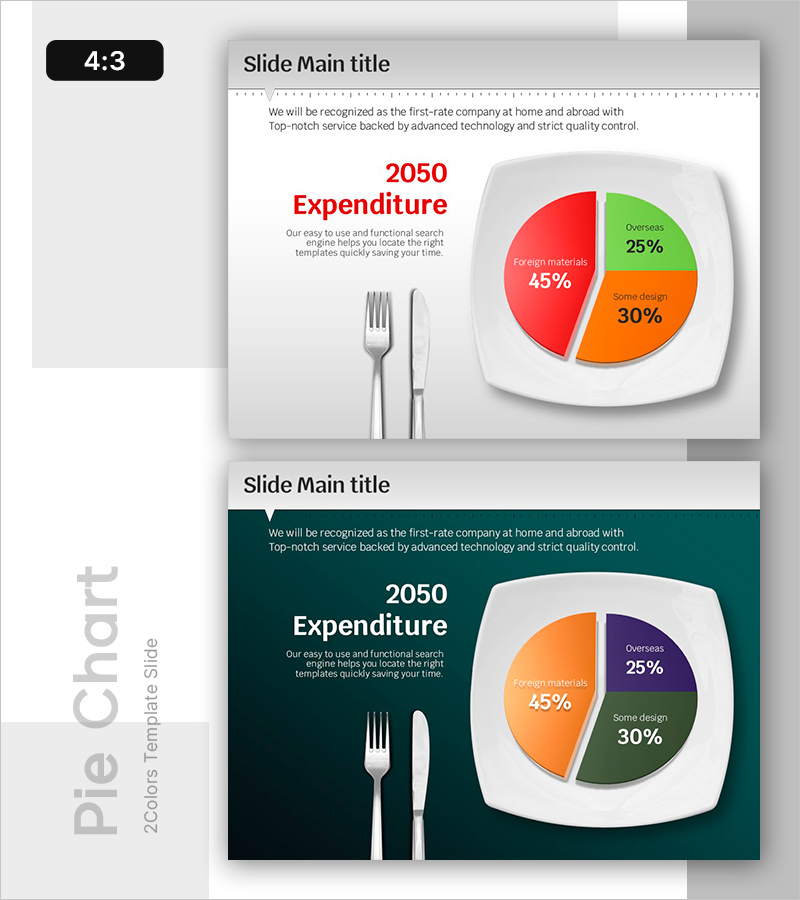
A 2-slide PowerPoint pie chart template set featuring 4-item ratio visualization in two design variants: light background and dark background. Each slide displays data distribution using red, orange, green, and purple color segments, ideal for expenditure breakdown, nutrient intake distribution, market share analysis, and budget allocation. Includes fork and knife illustration for food-related presentations. Fully editable in 4:3 aspect ratio PPTX format, compatible with all PowerPoint versions. Ready to insert into business reports, financial presentations, and analytical decks.
Usage Points
-
Main Usage
Visualize the relationship between parts and whole by displaying 4 data categories as percentage segments in a single pie chart. Effectively communicate budget allocation, market composition, nutritional distribution, or customer demographics. Color-coded segments enable instant visual comparison and improve audience comprehension of proportional relationships.
-
How to Use
Replace the sample percentages and labels with your actual data values. Select the light background version for projector-based presentations or the dark version for online meetings and printed materials. Remove the fork and knife illustration for general business use, or retain it for food, nutrition, or hospitality industry presentations.
-
Recommended For
Nutritionists and food companies presenting dietary analysis, finance teams reporting budget allocation and expense breakdown, marketing departments analyzing market share and customer segments, executives presenting business performance metrics, and students creating statistical analysis projects. Suitable for any organization requiring data-driven decision-making visualization.
-
Slide Structure
2-slide set with identical layout: centered 4-segment pie chart (45% red, 30% orange, 25% green, 25% purple) with left-aligned title and description area. Top section includes year/topic input field; bottom section provides legend space and additional notes area. Flexible design accommodates various data sets and presentation contexts.
Related Products
-

Galaxy Theme Market Share Pie Chart
#Product/Service Introduction #Market and Competitor Analysis #Graph
-

Business City Background Occupancy Graph
#Product/Service Introduction #Market and Competitor Analysis #Graph
-

Pie Chart for Market Share Analysis – Effective Data Visualization
#Product/Service Introduction #Market and Competitor Analysis #Graph
-

Red Green Detail Analysis Chart – Visualizing Market Share
#Market and Competitor Analysis #Graph #Market Status
