Sea Life Pi Type Chart – Market Share Analysis
RJ0600081_21
- Last Update 07/12/2025
- File Size 2.2MB
- # of Slides 2
- File Format PPTX
- Slide Ratio 16:9
- Color
Keywords
- #Content-Based Slides
- #Design-Based Slides
- #Business Strategy
- #Market and Competitor Analysis
- #Graph
- #Achievements
- #Market Share
- #Circles
- #Pie Chart
- #16:9
- #pie chart PowerPoint slide
- #circular chart template
- #ratio analysis presentation
- #marine life chart
- #market share pie chart
- #2-color pie chart download
- #how to create pie chart in PowerPoint
About the Product
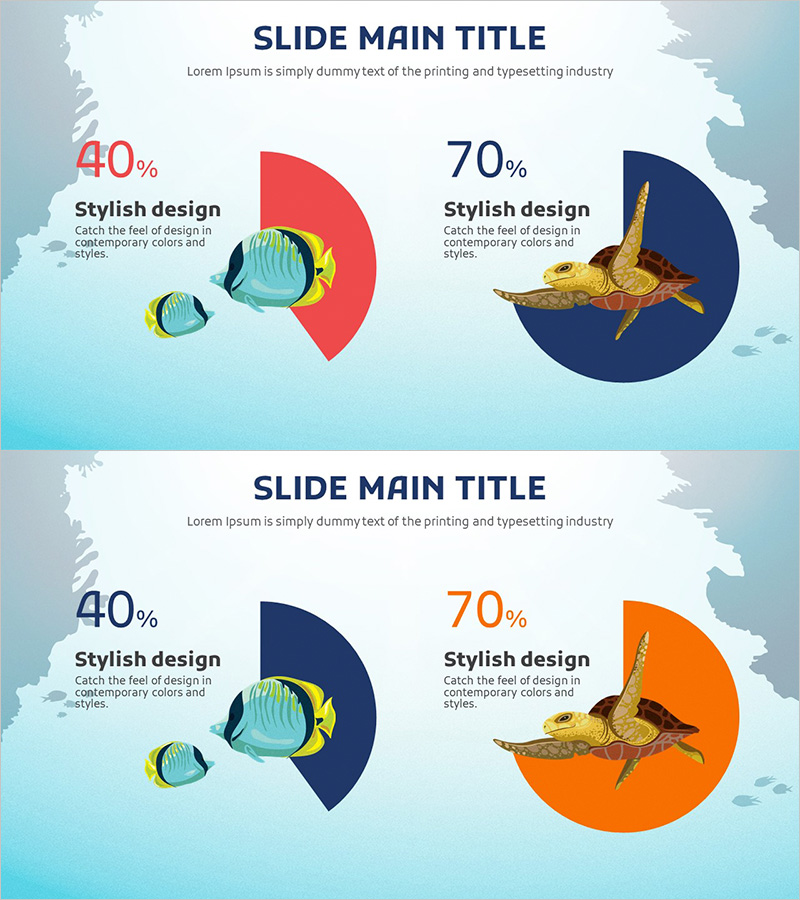
A PowerPoint pie chart slide featuring marine life illustrations for visual data representation. The design uses two color schemes—red and navy blue—to display two separate pie charts showing market share, sales ratios, customer composition, or budget allocation. The world map background and ocean creature icons create an engaging context for global market analysis, marine industry presentations, and environmental reports. Available in 16:9 widescreen PPTX format, all chart elements are fully editable to accommodate your specific data and labels.
Usage Points
-
Main Usage
Visualize two-item ratio comparisons such as market share, sales distribution, customer composition, or budget allocation using pie charts. The marine life icons and world map background provide contextual relevance for global market analysis, marine industry presentations, and environmental reporting.
-
How to Use
Double-click the pie chart values and labels to input your own data. Adjust colors through the Design tab if needed. The marine creature illustrations and background can be retained or removed as required. Customize text size and font to match your presentation style and audience.
-
Recommended For
Global marketing professionals, marine and fisheries industry employees, environmental report writers, market analysis consultants, sales performance presenters, investor relations specialists, and business development teams.
-
Slide Structure
2-slide set featuring two pie charts positioned side-by-side on each slide, displaying 40% and 70% ratio examples. Includes marine life illustrations (fish and shark) and world map background. Delivered in 16:9 widescreen PPTX format with fully editable chart elements.
Related Products
-

Energy Saving Practice Rate Survey Pie Chart
#Business Strategy #Market and Competitor Analysis #Graph
-

Camping Business Competitor Analysis Pie Chart
#Business Strategy #Market and Competitor Analysis #Graph
-

Eco-friendly Light Bulb Pie Chart – Market Share Analysis
#Market and Competitor Analysis #Graph #Market Status
-

Renewable Energy Target Market Strategy Icon
#Business Strategy #Market and Competitor Analysis #Diagram
