Visualizing Hawaii Travel Demand Forecast with Graphs
RB0600025_6
- Last Update 03/15/2025
- File Size 1MB
- # of Slides 2
- File Format PPTX
- Slide Ratio 4:3
- Color
Keywords
About the Product
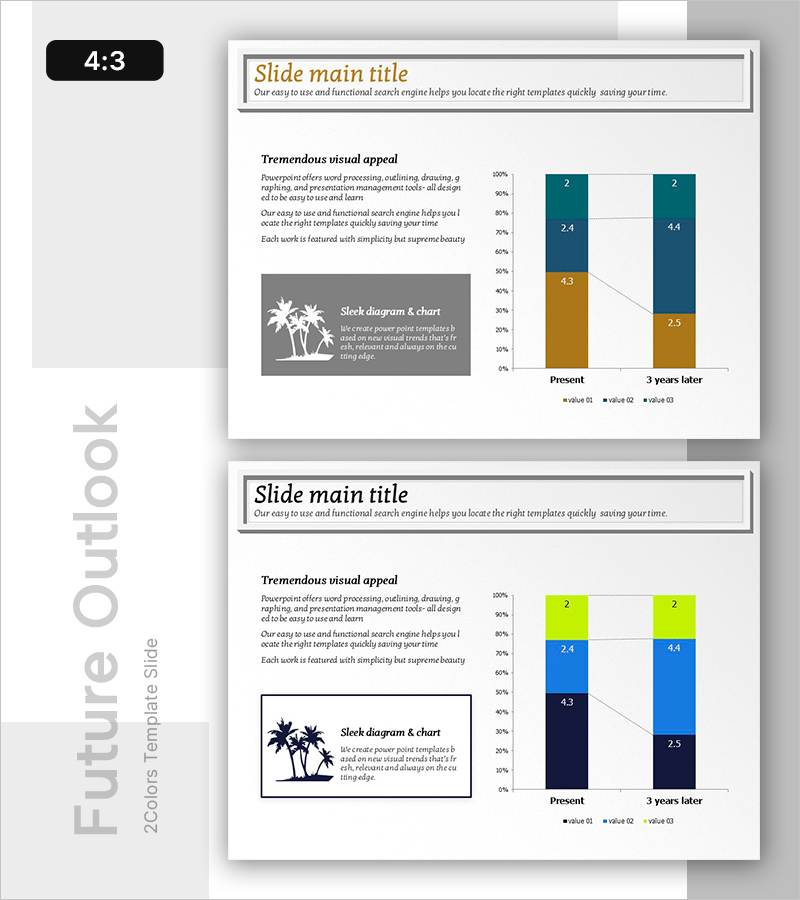
A vertical bar chart PowerPoint slide comparing present and 3-year-later data across two time periods. The slide features a dual-series bar graph in gold, dark teal, and light blue colors, enabling intuitive visualization of numerical changes over time. Perfect for travel demand forecasts, market analysis, sales trends, and other presentations requiring time-series data comparison. The 4:3 aspect ratio, 2-slide template is fully editable with customizable values and legend labels for immediate use in business presentations.
Usage Points
-
Main Usage
Visualize numerical changes across two time periods using a dual-series vertical bar chart. The side-by-side bar arrangement enables quick comparison of current state versus future projections, making growth rates and trend analysis immediately apparent to audiences.
-
How to Use
Apply to travel demand forecasting, market size trends, sales performance analysis, customer growth metrics, and other presentations requiring time-series comparison. Simply replace the data values and legend labels with your own figures for immediate presentation use.
-
Recommended For
Tourism and travel industry marketing presentations, market analysis reports, business performance reviews, financial analysis documents, and strategic planning presentations. Ideal for marketers, data analysts, business planners, and executives presenting quantitative comparisons.
-
Slide Structure
Two-slide template featuring title area and vertical bar chart on each slide. The chart displays 'Present' and '3 years later' data points using three color series (gold, dark teal, light blue), with legend indicators and Y-axis percentage scale for clear data interpretation.
Related Products
-

Changes in Crime Rates by Age Over Many Years – Insights from Data Analysis
#Market and Competitor Analysis #Graph #Future Outlook
-

Change Graph by Business Item – Market Trend Analysis
#Business Strategy #Market and Competitor Analysis #Graph
-

Camping Business Trend Graph – Future and Vision
#Market and Competitor Analysis #Graph #Customer Analysis
-

Market Growth Chart for Business Insights
#Market and Competitor Analysis #Diagram #Graph
