Changes in Crime Rates by Age Over Many Years – Insights from Data Analysis
RJ0800010_26
- Last Update 08/02/2025
- File Size 1MB
- # of Slides 2
- File Format PPTX
- Slide Ratio 16:9
- Color
Keywords
- #Content-Based Slides
- #Design-Based Slides
- #Market and Competitor Analysis
- #Graph
- #Future Outlook
- #Industry Trends
- #Column
- #Segmented Column
- #16:9
- #vertical bar chart PowerPoint
- #year-over-year data comparison slides
- #crime statistics presentation
- #bar graph template
- #data visualization PowerPoint template
About the Product
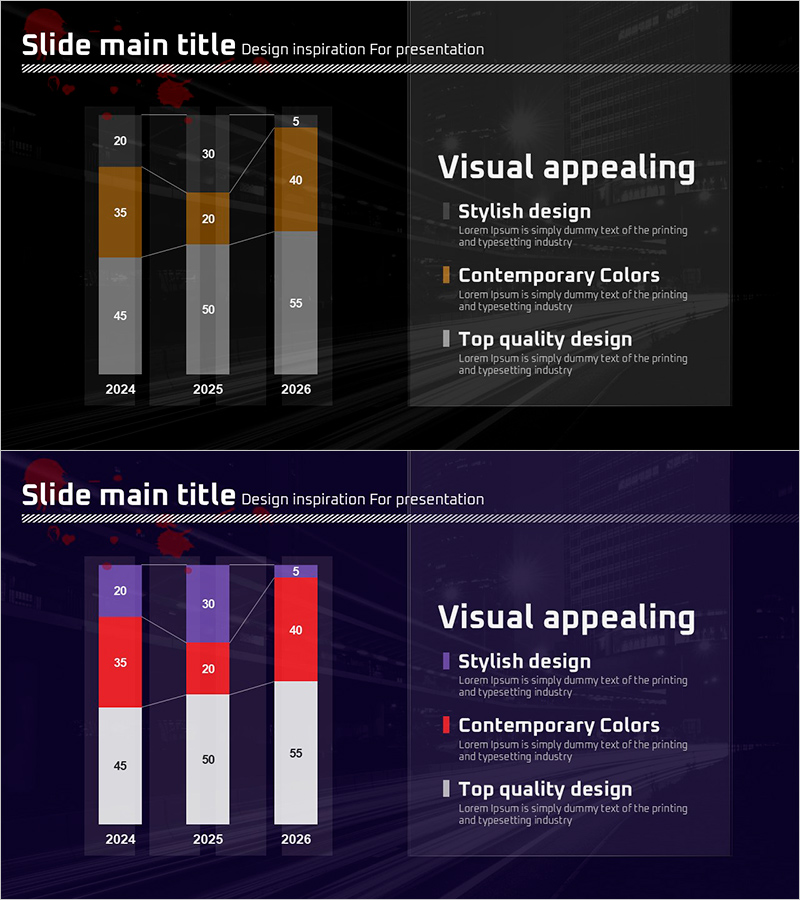
A vertical bar chart PowerPoint slide visualizing crime statistics from 2024 to 2026 across three consecutive years. The design features a two-tone color scheme combining burnt orange and gray tones, with numerical labels positioned above each bar segment for precise data communication. The 2-slide set includes a graph-focused layout on the first slide and an analysis-result format on the second slide with key insights positioned on the right side. Ideal for crime statistics presentations, social phenomenon analysis, policy reports, academic presentations, and data-driven business intelligence where temporal trend comparison is essential.
Usage Points
-
Main Usage
Visualizes annual crime statistics data using vertical bar charts to clearly express temporal trend changes across multiple years. Effectively communicates policy impact analysis, social phenomenon diagnosis, and statistics-based decision-making materials through intuitive numerical comparison and visual hierarchy.
-
How to Use
Use the first slide to explain data trends with the graph as the focal point, then populate the right-side text area on the second slide with key insights, conclusions, and policy recommendations. Replace bar values with actual data to customize the presentation for your specific analysis and reporting needs.
-
Recommended For
Government agencies (police, prosecution, justice ministry) crime statistics reports, university sociology and criminology lectures and thesis presentations, think tanks and research institutions policy analysis documents, media data journalism reference materials, and corporate social responsibility activity presentations.
-
Slide Structure
2-slide set. Slide 1: Left side features 3 vertical bars (2024, 2025, 2026) with 4-5 subdivided segments per bar, numerical labels, and connector lines. Slide 2: Identical graph on left side with right-side text boxes containing 3 key points about visual appeal, design style, contemporary colors, and quality design.
Related Products
-

Camping Business Trend Graph – Future and Vision
#Market and Competitor Analysis #Graph #Customer Analysis
-

Market Growth Chart for Business Insights
#Market and Competitor Analysis #Diagram #Graph
-

Visualization of Learning Response Data – Market Trend Analysis
#Market and Competitor Analysis #Graph #Future Outlook
-

Year-by-Year Breakdown Comparison Analysis Graph
#Market and Competitor Analysis #Graph #Future Outlook
