Visualization of Learning Response Data – Market Trend Analysis
RB0100003_6
- Last Update 03/01/2025
- File Size 1.8MB
- # of Slides 2
- File Format PPTX
- Slide Ratio 4:3
- Color
Keywords
- #Content-Based Slides
- #Design-Based Slides
- #Market and Competitor Analysis
- #Graph
- #Future Outlook
- #Market Analysis
- #Industry Trends
- #Column
- #Segmented Column
- #4:3
- #stacked bar chart PowerPoint
- #4-series data visualization slide
- #annual comparison template
- #market trend analysis PPT
- #competitive analysis chart
About the Product
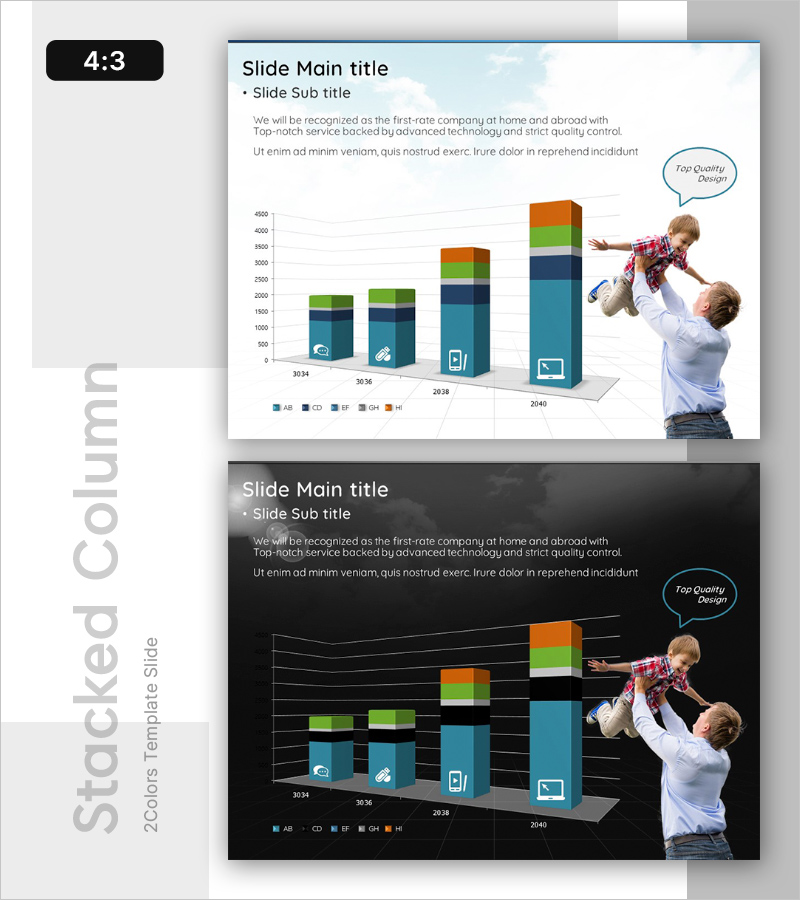
A stacked bar chart PowerPoint slide for visualizing learning response data across multiple dimensions. This presentation template displays 4 data series (AB, CD, EF, GH, HI) across years 3034–2040 in 3D stacked bars, making market trends and competitive analysis immediately clear. The multi-color scheme (teal, green, orange) distinguishes each category, while the legend and Y-axis scale ensure accurate data interpretation. Two slide versions—light sky-blue background and dark background—adapt to any presentation environment. Fully editable PPTX format ready for immediate customization.
Usage Points
-
Main Usage
Compare multi-dimensional data across years and analyze market trends at a glance. The 3D stacked bar format reveals growth rates, declines, and competitive positioning across four data series simultaneously.
-
How to Use
Use in business reports, marketing plans, and investor presentations to compare market size, customer response, sales performance, or other multi-metric indicators. Reference the legend to clarify each series' meaning before presenting for maximum audience comprehension.
-
Recommended For
Data analysts, marketing strategists, executives, and consultants presenting quarterly or annual performance comparisons, competitive benchmarking, or market share analysis. Ideal for stakeholder reports and strategic planning sessions.
-
Slide Structure
Two-slide set: Slide 1 features a light sky-blue background with 4-series stacked bar chart (years 3034–2040); Slide 2 presents the identical chart structure on dark background. Both include title, subtitle, descriptive text areas, and a callout bubble accent in the upper right.
Related Products
-

Market Trends and Analysis Green Navy – Clearly Displaying Market Trends
#Market and Competitor Analysis #Graph #Market Analysis
-

Future Outlook Segmented Bar Graph – Essential Slide for Market Analysis
#Market and Competitor Analysis #Graph #Text Box
-

5-Year Real Estate Volume Chart – Market Analysis
#Market and Competitor Analysis #Graph #Market Analysis
-

Visualizing Hawaii Travel Demand Forecast with Graphs
#Market and Competitor Analysis #Graph #Future Outlook
