Change Graph by Business Item – Market Trend Analysis
RB0100052_5
- Last Update 03/06/2025
- File Size 0.7MB
- # of Slides 2
- File Format PPTX
- Slide Ratio 4:3
- Color
Keywords
- #Content-Based Slides
- #Design-Based Slides
- #Business Strategy
- #Market and Competitor Analysis
- #Graph
- #Future Outlook
- #Industry Trends
- #Column
- #Segmented Column
- #4:3
- #stacked bar chart PowerPoint
- #multi-series bar graph slide
- #market trend analysis presentation
- #business comparison chart
- #revenue forecast PPT slide
About the Product
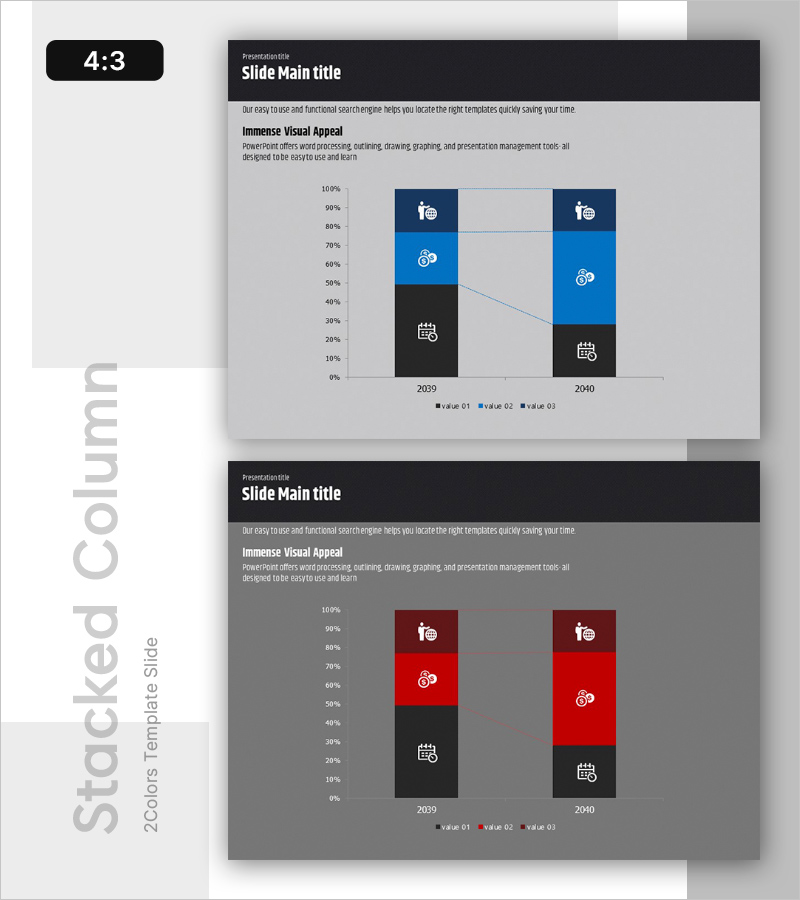
A stacked bar chart PowerPoint slide that visualizes business item changes across two time periods. This presentation template displays 2039 and 2040 data with three distinct series (black, blue, red) to compare metrics by category. Ideal for market trend analysis, revenue forecasting, and business performance reporting. The slide enables quick visual comparison of multi-dimensional data points and is fully editable in 4:3 aspect ratio PPTX format. Perfect for financial reports, investor presentations, and strategic planning decks.
Usage Points
-
Main Usage
Compares multiple business metrics such as revenue, sales volume, and market share across different time periods. The stacked structure clearly distinguishes sub-categories within each item, making it effective for complex data visualization.
-
How to Use
Use in business reports, investor presentations, marketing strategy meetings, and quarterly performance reviews to present quantitative evidence. Easily customize legend labels, axis titles, and data values to match your specific dataset.
-
Recommended For
Finance professionals, business analysts, marketing managers, and executives presenting data-driven insights. Suitable for anyone needing to communicate comparative performance metrics to stakeholders.
-
Slide Structure
2-slide set featuring identical stacked bar chart layouts. Each slide displays 3 color-coded series (black, blue, red) with side-by-side bars for 2039 and 2040, enabling intuitive year-over-year comparison and trend analysis.
Related Products
-

Subdivision Vertical Graph Comparison Type – Optimal for Business Strategy Analysis
#Business Strategy #Market and Competitor Analysis #Graph
-

Camping Business Trend Graph – Future and Vision
#Market and Competitor Analysis #Graph #Customer Analysis
-

Visualizing the Changing Trend of the Ageing Population with a 100% Stacked Bar Graph
#Business Strategy #Market and Competitor Analysis #Marketing Plan and Strategy
-

Analyzing Future Prospect Graphs
#Market and Competitor Analysis #Diagram #Graph
