Change Trend According to Situation – Market Trends and Analysis
RB0600024_4
- Last Update 03/14/2025
- File Size 0.2MB
- # of Slides 2
- File Format PPTX
- Slide Ratio 4:3
- Color
Keywords
- #Content-Based Slides
- #Design-Based Slides
- #Market and Competitor Analysis
- #Graph
- #Customer Analysis
- #Industry Trends
- #Column
- #Segmented Column
- #4:3
- #stacked column chart PowerPoint
- #market trend analysis slide
- #4-series bar graph template
- #competitive analysis chart
- #cumulative chart PowerPoint
- #data visualization slide
About the Product
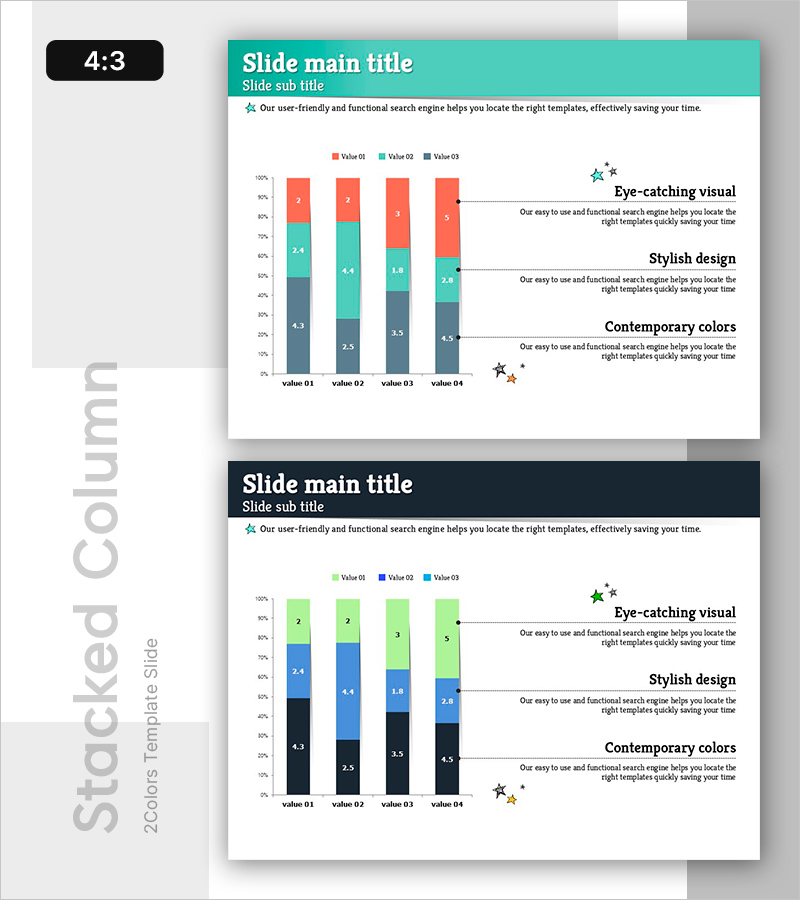
A stacked column chart PowerPoint slide designed for market trend analysis and competitive benchmarking. This template visualizes four data series in a cumulative bar format, making it ideal for business reports and market analysis presentations. The design uses a teal, gray, orange, and red color palette with embedded data labels for clear numerical reference. The 4:3 aspect ratio and 2-slide layout ensure compatibility with standard presentation environments and allow for immediate customization.
Usage Points
-
Main Usage
Visualizes multi-series data in cumulative format to display both total volume and component proportions simultaneously. Effectively communicates detailed numerical comparisons across quarters, years, or competitors with embedded data labels for transparency.
-
How to Use
Apply to business reports, market analysis documents, investor presentations, and executive briefings for quarterly or annual performance comparisons. The editable structure allows quick data input with automatic chart updates.
-
Recommended For
Marketing teams, strategy departments, finance teams, and executives presenting market conditions, performance metrics, or competitive positioning. Suitable for academic presentations and consulting proposals.
-
Slide Structure
2-slide set. Teal header bar with title and subtitle; central stacked column chart with 4 items (value 01–04) and 4 series (gray, teal, orange, red); right-aligned annotation boxes with 3 key insights. Data labels embedded within each bar segment.
Related Products
-

Segmented Vertical Bar Graph Blue Yellow – Customer Analysis and Market Trends
#Market and Competitor Analysis #Graph #Customer Analysis
-

3D Segmented Bar Graph for Performance Analysis – Market Trends
#Market and Competitor Analysis #Graph #Customer Analysis
-

Body Fat Change After Running – Market Analysis
#Market and Competitor Analysis #Graph #Customer Analysis
-

Camping Business Trend Graph – Future and Vision
#Market and Competitor Analysis #Graph #Customer Analysis
