Segmented Vertical Bar Graph Blue Yellow – Customer Analysis and Market Trends
RJ0600026_18
- Last Update 06/27/2025
- File Size 12.9MB
- # of Slides 2
- File Format PPTX
- Slide Ratio 16:9
- Color
Keywords
- #Content-Based Slides
- #Design-Based Slides
- #Market and Competitor Analysis
- #Graph
- #Customer Analysis
- #Industry Trends
- #Column
- #Segmented Column
- #16:9
- #segmented vertical bar chart PowerPoint
- #4-series stacked column slide
- #year-over-year comparison template
- #customer analysis chart PPT
- #market trend graph presentation
About the Product
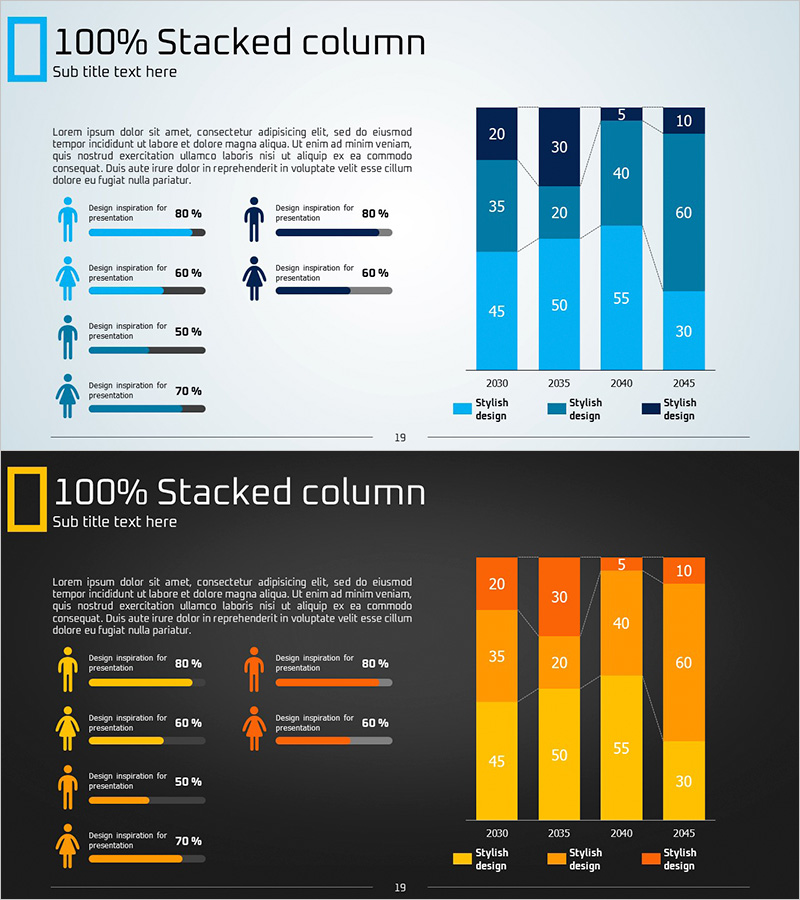
A segmented vertical bar chart PowerPoint slide visualizing four data series across 2030 to 2045, designed for customer analysis and market trend presentations. The slide features blue, light blue, dark blue, and yellow color schemes with clear numerical labels within each bar segment, enabling precise data interpretation. This 16:9 widescreen slide deck (2 slides) is ready to download and customize immediately. The stacked column structure effectively displays multi-dimensional data comparisons, making it ideal for business reports, investor presentations, and strategic planning decks.
Usage Points
-
Main Usage
Displays year-over-year trends and comparisons of four data series from 2030 to 2045 in a single visual. Ideal for visualizing customer segment growth rates, market share evolution, departmental performance metrics, and multi-category data analysis. Numerical labels within each segment ensure accurate value communication.
-
How to Use
Insert into business presentations, marketing plans, and performance reports in market analysis or results sections. Easily edit data directly in PowerPoint to replace with your own figures, and adjust colors as needed. Serves as a focal point chart during presentations to capture audience attention and support data-driven discussions.
-
Recommended For
Marketing managers, business planners, financial analysts, consultants, and sales directors preparing customer analysis and market trend materials. Suitable for quarterly and annual performance reviews, investor reporting, and strategic planning meetings where data visualization supports decision-making.
-
Slide Structure
2-slide deck with each slide displaying 4 vertical bars (2030, 2035, 2040, 2045) segmented into 4 series (blue, light blue, dark blue, yellow). Numerical values (20, 30, 40, 50, 60, etc.) are labeled within bar segments, with a legend identifying each series. 16:9 widescreen format optimized for modern presentation environments.
Related Products
-

Camping Business Trend Graph – Future and Vision
#Market and Competitor Analysis #Graph #Customer Analysis
-

3D Segmented Bar Graph for Performance Analysis – Market Trends
#Market and Competitor Analysis #Graph #Customer Analysis
-

Change Trend According to Situation – Market Trends and Analysis
#Market and Competitor Analysis #Graph #Customer Analysis
-

Target Analysis Subdivided Vertical Bar Graph – Harmonizing Blue and Green
#Market and Competitor Analysis #Graph #Customer Analysis
