Target Analysis Subdivided Vertical Bar Graph – Harmonizing Blue and Green
RJ0600027_21
- Last Update 06/27/2025
- File Size 0.2MB
- # of Slides 2
- File Format PPTX
- Slide Ratio 16:9
- Color
Keywords
- #Content-Based Slides
- #Design-Based Slides
- #Market and Competitor Analysis
- #Graph
- #Customer Analysis
- #Industry Trends
- #Column
- #Segmented Column
- #16:9
- #subdivided vertical bar chart PowerPoint
- #target analysis presentation slide
- #4-series comparison graph
- #market trend chart
- #customer analysis template
About the Product
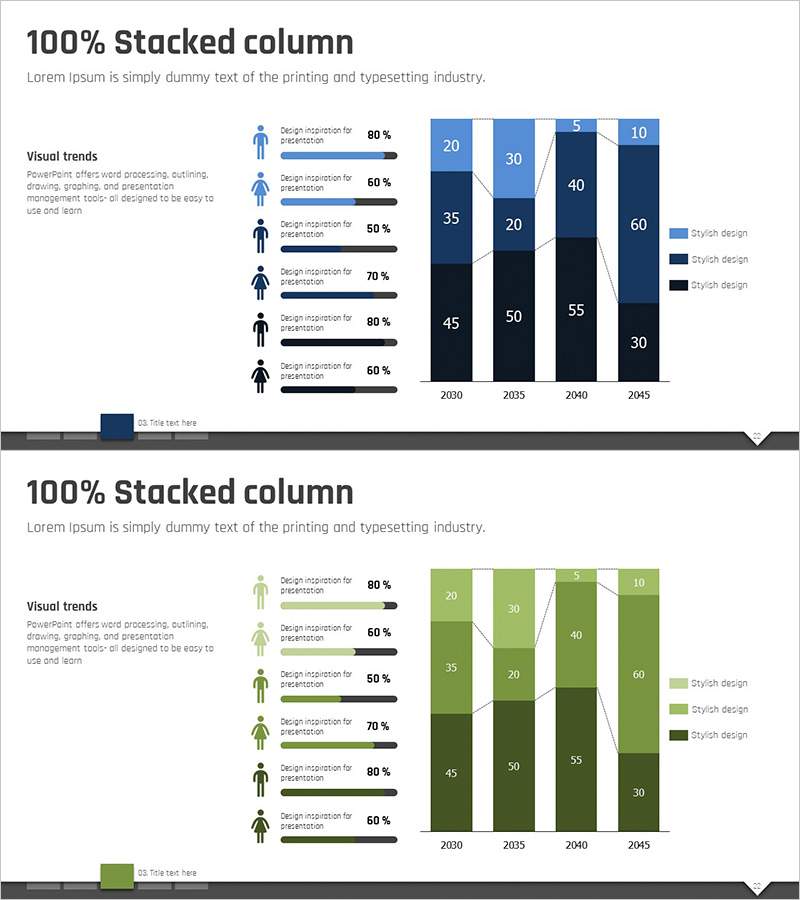
A subdivided vertical bar chart PowerPoint slide designed for target analysis and market trend visualization. This presentation template displays data across four series from 2030 to 2045, color-coded in blue, black, and green for clear differentiation. Each year shows stacked bar segments with individual values and total sums clearly labeled, making it ideal for customer analysis, market share tracking, sales trends, and competitive positioning. The 16:9 widescreen format includes 2 fully editable slides ready to integrate into your business presentations.
Usage Points
-
Main Usage
Compare multiple data series across years in stacked format to reveal market trends, customer segmentation, and sales performance at a glance. The design simultaneously displays individual series values and total aggregates, making it easy to communicate both component and overall relationships.
-
How to Use
Input your numerical data for 4 years (2030–2045) and 3–4 series categories; the stacked bar structure automatically organizes the information. Customize colors and values as needed, then embed into quarterly reports, strategic presentations, or market analysis documents.
-
Recommended For
Marketing teams analyzing market share by segment, sales teams reporting customer cohort performance, executive presentations on business results, and consulting reports requiring multi-year trend analysis. Particularly effective when comparing subdivided categories across extended time periods.
-
Slide Structure
2-slide template featuring vertical bar charts for 4 years (2030/2035/2040/2045). Each bar is subdivided into 3–4 color-coded series (blue, black, green) stacked vertically, with total sums displayed above. Left panel includes Visual trends section with 6 descriptive items and progress bars. Legend identifies each series for clarity.
Related Products
-

3D Segmented Bar Graph for Performance Analysis – Market Trends
#Market and Competitor Analysis #Graph #Customer Analysis
-

Segmented Vertical Bar Graph Blue Yellow – Customer Analysis and Market Trends
#Market and Competitor Analysis #Graph #Customer Analysis
-

Body Fat Change After Running – Market Analysis
#Market and Competitor Analysis #Graph #Customer Analysis
-

Change Trend According to Situation – Market Trends and Analysis
#Market and Competitor Analysis #Graph #Customer Analysis
