Year-by-Year Breakdown Comparison Analysis Graph
RJ0300095_6
- Last Update 05/16/2025
- File Size 0.3MB
- # of Slides 2
- File Format PPTX
- Slide Ratio 16:9
- Color
Keywords
- #Content-Based Slides
- #Design-Based Slides
- #Market and Competitor Analysis
- #Graph
- #Future Outlook
- #Industry Trends
- #Column
- #Segmented Column
- #16:9
- #stacked column chart PowerPoint
- #year-over-year comparison slide
- #data visualization template
- #market trend analysis chart
- #business presentation slide
- #how to create stacked chart in PowerPoint
About the Product
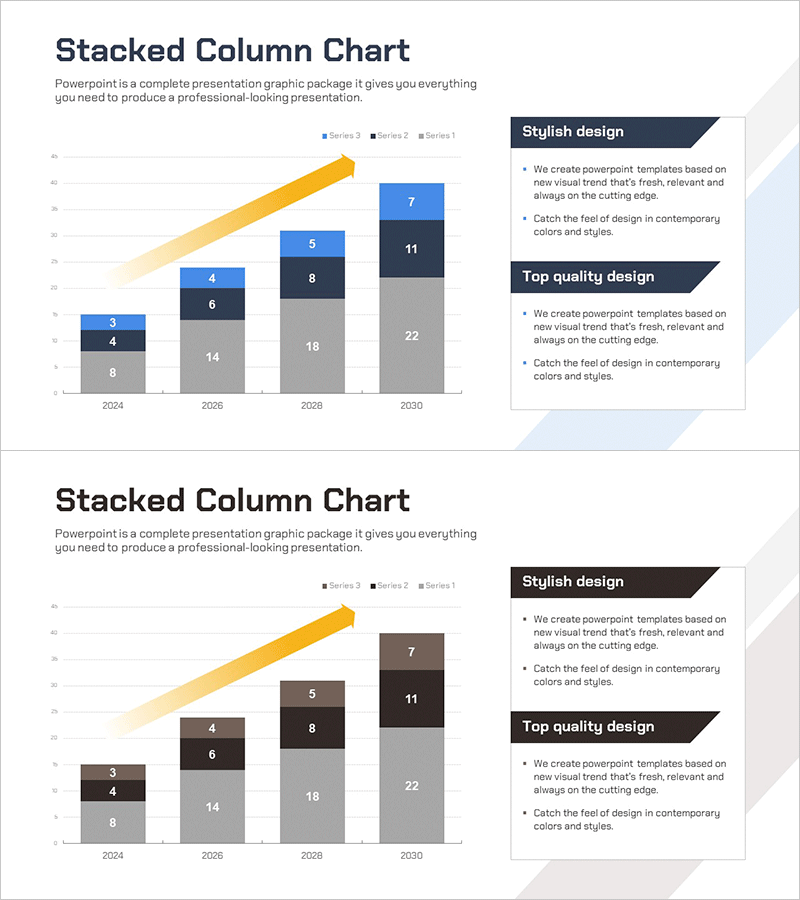
A professional stacked column chart PowerPoint slide for comparing year-over-year data trends from 2024 to 2030. The slide features three data series displayed in gray, blue, and orange gradient colors, enabling clear visualization of component composition changes across four years. Ideal for market analysis presentations, competitive benchmarking, and business forecasting. The template includes two design variations optimized for 16:9 widescreen format, allowing immediate use in business reports, quarterly performance reviews, and strategic planning decks.
Usage Points
-
Main Usage
Visualize multi-year data trends while simultaneously displaying the composition ratio of each component. Effectively communicate market size changes, product category revenue distribution, customer segment evolution, and other complex datasets in a single, easy-to-understand chart format.
-
How to Use
Insert this slide into business plans, quarterly earnings reports, market analysis presentations, and competitive benchmarking documents. Simply click on each column to input your data, and the chart automatically updates. Compatible with PowerPoint 2016 and later versions.
-
Recommended For
Marketing managers, executives, financial analysts, management consultants, and business development teams presenting quarterly or annual performance analysis, market size trends, product portfolio evolution, and strategic forecasts to stakeholders.
-
Slide Structure
Two-slide template with design variations: the first features a blue background with an orange trend arrow accent, while the second uses a brown-toned background. Both slides display 2024–2030 data across four years with three stacked series (gray, blue, orange) and data labels for clarity.
Related Products
-

Changes in Crime Rates by Age Over Many Years – Insights from Data Analysis
#Market and Competitor Analysis #Graph #Future Outlook
-

Camping Business Trend Graph – Future and Vision
#Market and Competitor Analysis #Graph #Customer Analysis
-

Visualization of Learning Response Data – Market Trend Analysis
#Market and Competitor Analysis #Graph #Future Outlook
-

Market Growth Chart for Business Insights
#Market and Competitor Analysis #Diagram #Graph
