Market Growth Chart for Business Insights
RJ0600108_17
- Last Update 07/20/2025
- File Size 0.8MB
- # of Slides 2
- File Format PPTX
- Slide Ratio 16:9
- Color
Keywords
- #Content-Based Slides
- #Design-Based Slides
- #Market and Competitor Analysis
- #Diagram
- #Graph
- #Future Outlook
- #Industry Trends
- #Table
- #Column
- #Standard Table
- #Segmented Column
- #16:9
- #vertical bar chart PowerPoint
- #market growth chart slide
- #data visualization presentation
- #business analysis graph
- #how to create bar chart in PowerPoint
About the Product
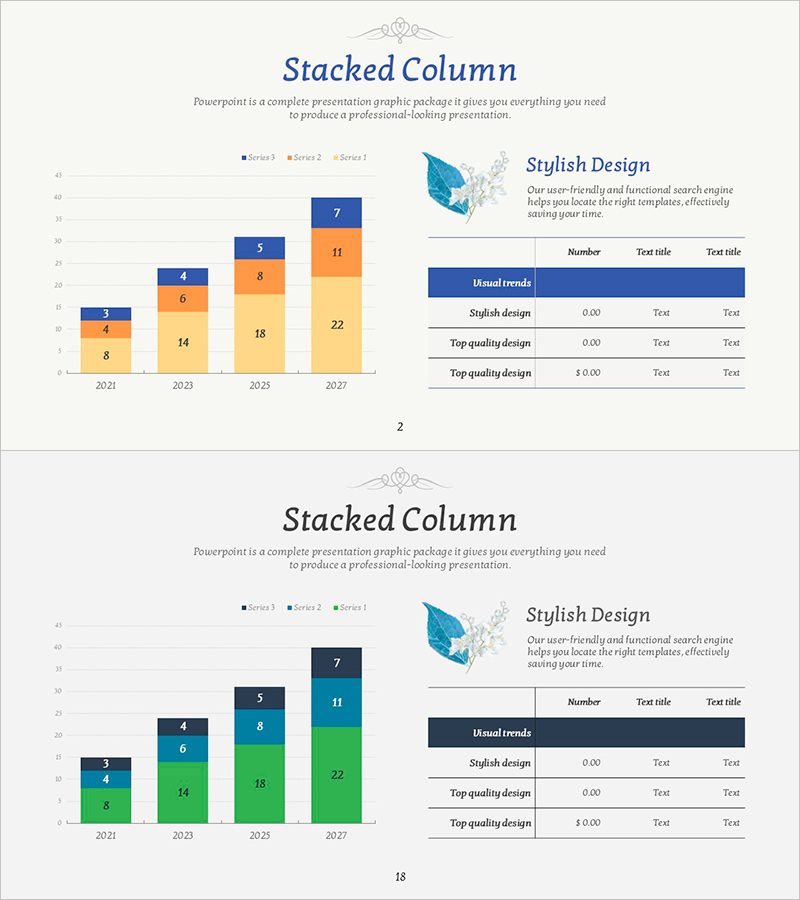
A PowerPoint slide featuring a vertical bar chart that visualizes market growth trends across four data series from 2021 to 2027. Each series is distinguished by color (blue, orange, yellow, and light orange) for easy comparison and analysis. The right side includes a table section titled 'Usual trends' with supplementary numerical data and descriptions. The harmonious color palette and clean layout make this slide ideal for business presentations, financial reports, and strategic planning meetings. Two slide variations are provided: one with a light background and one with a dark background to suit different presentation environments.
Usage Points
-
Main Usage
Visualize multi-series data such as annual market size changes, competitor performance comparisons, and departmental revenue trends using vertical bar charts. Clearly communicate business insights to support data-driven decision-making in executive reports, investor presentations, and business plan pitches.
-
How to Use
Compare data series intuitively by observing bar heights and colors. Enter specific numerical values and explanations in the right-side table to supplement the chart data. Choose between light or dark background versions depending on your presentation environment and projector setup.
-
Recommended For
Finance professionals, marketing strategists, executives, consultants, and data analysts who need to present quantitative insights. Ideal for quarterly performance reports, market research presentations, competitive analysis, and business performance evaluations.
-
Slide Structure
Slide 1: Light background (beige/cream) with 4-series vertical bar chart (2021–2027, blue/orange/yellow/light orange colors) + right-side table (Usual trends header with 3 data entry rows). Slide 2: Identical layout with dark background (navy/charcoal) optimized for projector environments.
Related Products
-

Analyzing Future Prospect Graphs
#Market and Competitor Analysis #Diagram #Graph
-

Market Analysis with Horizontal and Vertical Bar Charts – Recent Trends Review
#Market and Competitor Analysis #Financial Plans and Performance #Diagram
-

Structure Presentation Template Segmented Vertical Bar Graph – Market Trends and Performance Analysis
#Market and Competitor Analysis #Financial Plans and Performance #Diagram
-

Year-by-Year Breakdown Comparison Analysis Graph
#Market and Competitor Analysis #Graph #Future Outlook
