Business Sales and Profit Statement – Profit and Loss Visualization
RJ0400061_18
- Last Update 06/03/2025
- File Size 0.7MB
- # of Slides 2
- File Format PPTX
- Slide Ratio 16:9
- Color
Keywords
- #Content-Based Slides
- #Design-Based Slides
- #Financial Plans and Performance
- #Diagram
- #Other
- #Income Statement
- #Sales and Revenue
- #Table
- #Standard Table
- #16:9
- #sales table PowerPoint
- #profit and loss statement slide
- #financial data visualization
- #revenue table PPT template
- #business table slide design
About the Product
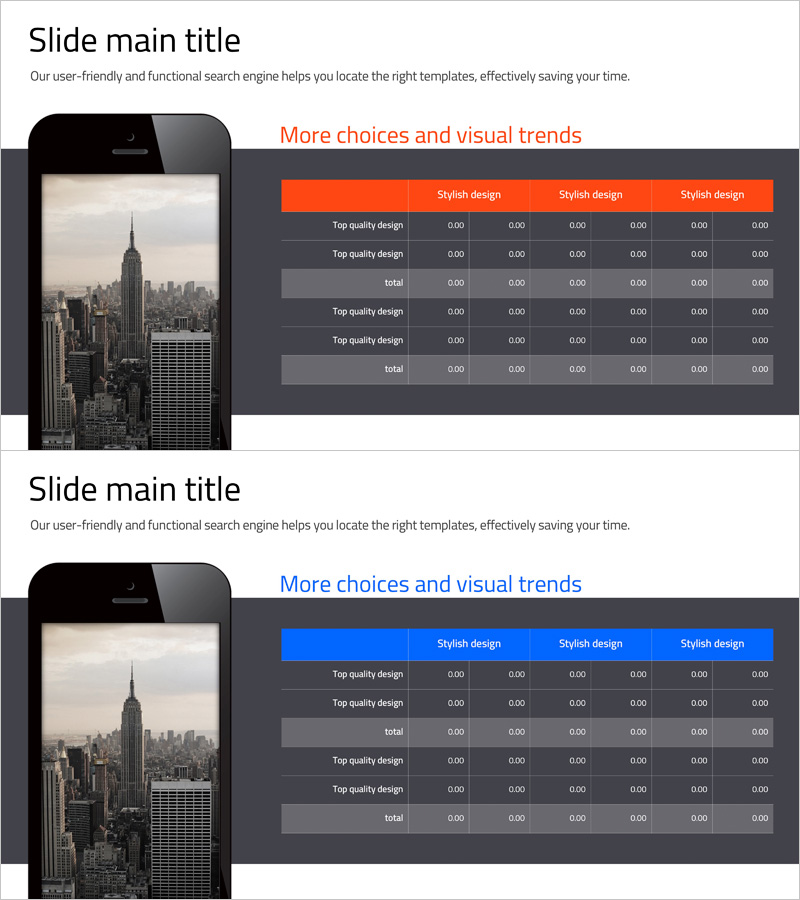
A professional table-based PowerPoint slide designed to visualize business financial data with clarity and impact. The slide features orange and blue header rows that create strong visual contrast, making key financial metrics stand out immediately. Sales, revenue, and profit-loss items are arranged in a structured matrix format, enabling quick comparative analysis across multiple data points. This 2-slide set accommodates various financial datasets, optimized for 16:9 widescreen presentations. Perfect for profit-and-loss statements, financial reports, and business plan pitches that require data-driven credibility.
Usage Points
-
Main Usage
Communicate financial performance, profit-and-loss status, and revenue trends through a structured table format. The matrix layout enables simultaneous comparison of multiple line items, while orange and blue header colors guide audience attention and segment information logically. Ideal for profit statements, financial analysis, and business performance presentations.
-
How to Use
Input actual sales, revenue, and profit-loss figures directly into the table cells for financial reports or business plan presentations. Customize header colors (orange/blue) to match your corporate brand identity, or expand rows and columns to accommodate additional financial data. The 16:9 aspect ratio ensures optimal display on projectors and online presentation platforms.
-
Recommended For
CFOs, finance managers, and executives presenting quarterly or annual financial performance. Effective for investor briefings, shareholder meetings, and internal management reports requiring transparent profit-and-loss disclosure. Startups can leverage this template during investor pitch decks to demonstrate financial viability and operational transparency.
-
Slide Structure
2-slide set with each slide containing a 6-column × 5-row table structure. The first row features orange headers (Stylish design labels), the second row displays blue headers (Stylish design labels), and remaining rows contain numerical data in 0.00 format. Total and subtotal rows are highlighted in gray for emphasis and clarity.
Related Products
-

Sales and Profit Table – Visualizing Financial Performance
#Financial Plans and Performance #Diagram #Other
-

Sales and Profit Table – Clear Visualization of Financial Planning
#Financial Plans and Performance #Diagram #Other
-

Global Revenue Analysis Table – Table for Financial Performance Enhancement
#Financial Plans and Performance #Diagram #Other
-

Sales and Profit Comparison Graph & Table – Clear Financial Analysis
#Financial Plans and Performance #Diagram #Graph
