Visual Summary of Key Indicators – Leveraging Graphs for Market Analysis
RB0600003_4
- Last Update 03/14/2025
- File Size 1.7MB
- # of Slides 2
- File Format PPTX
- Slide Ratio 4:3
- Color
Keywords
About the Product
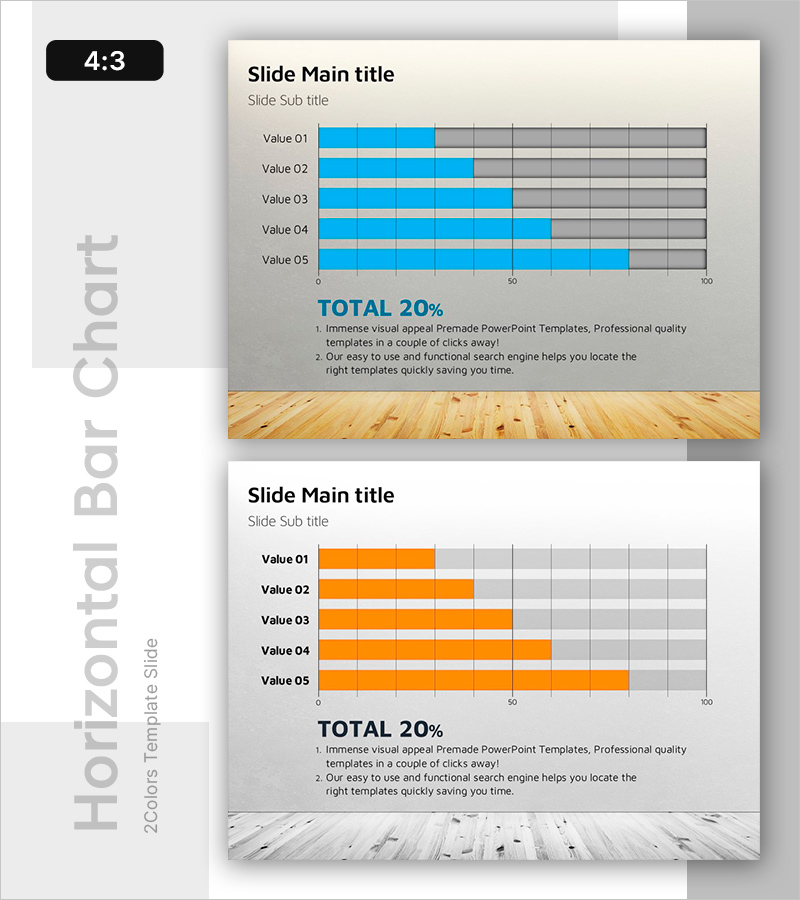
A horizontal bar chart PowerPoint slide optimized for market analysis and key performance indicator comparisons. This template provides two color versions (blue and orange) to visualize 5 data points side by side, making it ideal for competitive benchmarking, departmental performance reviews, and target-versus-actual analysis. The 4:3 aspect ratio PPTX format ensures compatibility with existing presentations, while clearly defined data entry areas enable immediate editing and customization for reports, proposals, and executive briefings.
Usage Points
-
Main Usage
Displays numerical data in horizontal bars to enable intuitive size comparison across items. Ideal for target-versus-actual reporting, regional or departmental performance metrics, product sales comparisons, and competitive analysis. Provides credible data visualization for business meetings, reports, and proposals.
-
How to Use
Enter item names (Value 01–05) and corresponding values; bar lengths adjust automatically. Select the blue version for formal, trust-focused presentations or the orange version for dynamic, positive-tone presentations. The wood-textured background adds warmth to your slide design.
-
Recommended For
Finance, marketing, and sales teams presenting quarterly or annual performance reports, market research findings, product sales rankings, customer satisfaction surveys, and executive management briefings. Most effective when comparing 5 or fewer data points.
-
Slide Structure
Each slide contains a title and subtitle area, 5 item labels (Value 01–05), colored bars (blue or orange) with gray background bars for reference, and a summary section with 'TOTAL 20%' text and two lines of descriptive content for concise result documentation.
Related Products
-

Fire Dispatch Graph – Market Analysis and Competitive Advantage
#Market and Competitor Analysis #Graph #Market Analysis
-

Business Analysis Graph Slide - Market and Competitor Analysis
#Market and Competitor Analysis #Graph #Market Analysis
-

Competitor and Market Analysis Slide – Pink & Bluegreen PowerPoint Template
#Market and Competitor Analysis #Graph #Competitor Analysis
-

Horizontal Bar Chart for Learning Method Survey Analysis – Strategic Approach
#Market and Competitor Analysis #Marketing Plan and Strategy #Graph
