Strategic Goal Progress Template
RB0500018_6
- Last Update 03/14/2025
- File Size 1.7MB
- # of Slides 2
- File Format PPTX
- Slide Ratio 4:3
- Color
Keywords
- #Content-Based Slides
- #Design-Based Slides
- #Business Strategy
- #Diagram
- #Graph
- #Achievements
- #Flow
- #Horizontal Bar
- #Linear Flow
- #Horizontal Bar Chart
- #Project Progress
- #4:3
- #circular diagram PowerPoint slide
- #horizontal bar chart presentation
- #goal progress visualization
- #business strategy PPT
- #4-stage process diagram template
About the Product
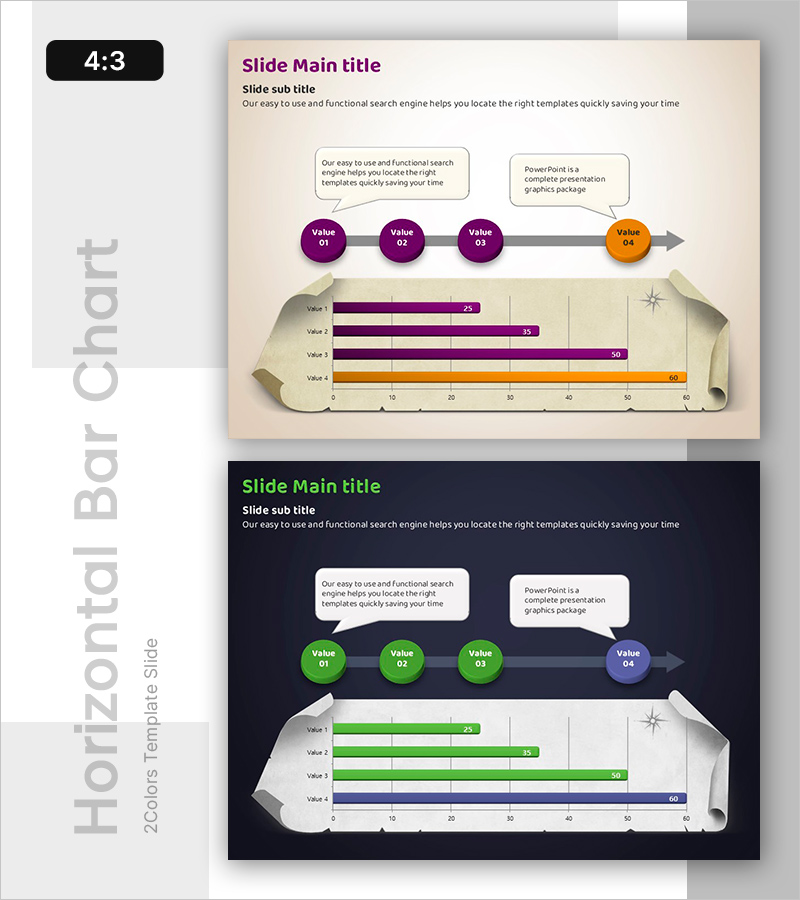
A PowerPoint slide that visualizes strategic goal achievement progress using a 4-stage circular diagram and horizontal bar chart. Purple and orange circular nodes represent the process flow, while four horizontal bars below display progress percentages for each item. Speech bubble text boxes allow you to add key explanations, making this template immediately applicable for business strategy presentations, performance reports, and operational improvement discussions. Provided in 4:3 aspect ratio with 2 slides.
Usage Points
-
Main Usage
Simultaneously displays step-by-step progress of strategic goals and achievement rates for each item. The circular diagram emphasizes process flow and connectivity, while the horizontal bar chart clearly compares numerical progress percentages. Ideal for executive reports, business performance presentations, and strategic planning meetings.
-
How to Use
On slide 1, change the four node labels to your goal stage names and enter descriptions in the speech bubbles. On slide 2, update the Value 1-4 labels and numbers with your actual progress data. Colors can be adjusted to match your corporate brand guidelines.
-
Recommended For
Strategic and planning team goal achievement reports, business department quarterly and annual performance presentations, executive-level strategy planning meetings, project manager progress updates, organizational improvement and operational efficiency proposals.
-
Slide Structure
Slide 1: 4 circular nodes (Value 01-04) connected by arrows in circular flow, 2 speech bubble text boxes / Slide 2: Horizontal bar chart with 4 items (Value 1-4), 0-60 numerical axis, purple and orange color differentiation
Related Products
-

Premium Management Presentation Horizontal Bar Graph
#Business Strategy #Graph #Achievements
-

Renewable Energy Business Process Arrow Icon
#Business Strategy #Diagram #Business Direction
-

Preferred Menu Survey Visualization with Horizontal Bar Chart
#Company Introduction #Business Strategy #Graph
-

Linear Diagram for Visualizing Business Progress – Second Key Step
#Business Strategy #Diagram #Business Direction
