Premium Management Presentation Horizontal Bar Graph
RJ0200031_6
- Last Update 04/06/2025
- File Size 7.7MB
- # of Slides 2
- File Format PPTX
- Slide Ratio 16:9
- Color
Keywords
- #Content-Based Slides
- #Design-Based Slides
- #Business Strategy
- #Graph
- #Achievements
- #Horizontal Bar
- #Horizontal Bar Chart
- #Project Progress
- #16:9
- #horizontal bar chart PowerPoint
- #bar graph presentation slide
- #comparison chart template
- #business performance report PPT
- #data visualization slide download
About the Product
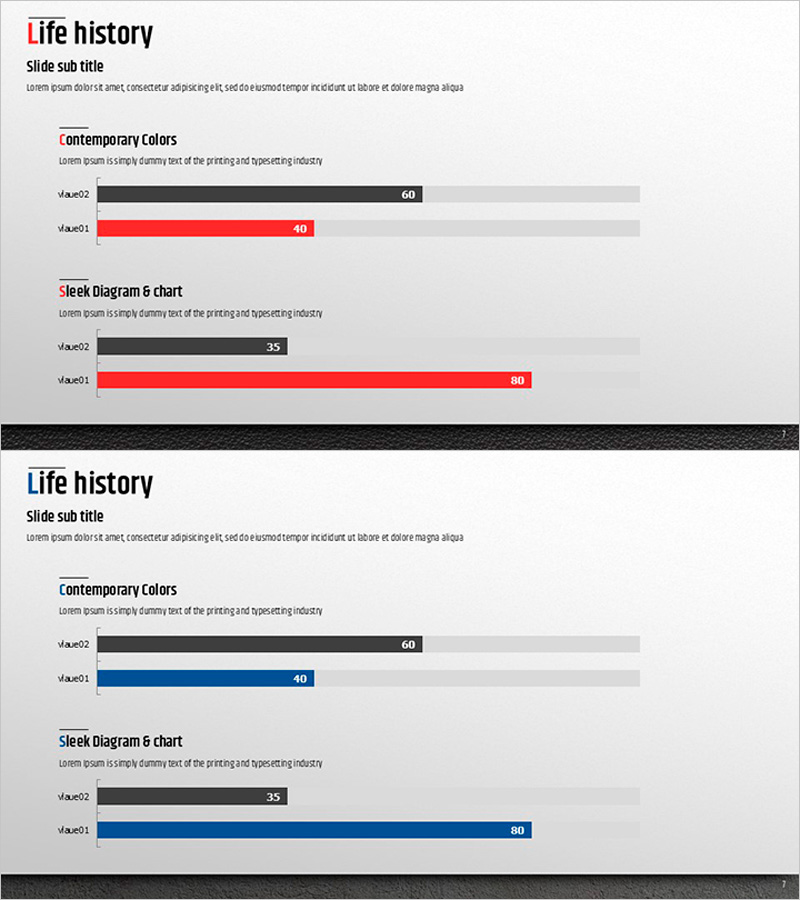
A horizontal bar chart PowerPoint slide designed to clearly compare and analyze business progress and performance metrics. The contrasting black and red color scheme enables immediate visual comparison of two data items (v.ver02, v.ver01), with numerical labels displayed above each bar for precise data communication. Composed of 2 slides in 16:9 widescreen format, this presentation template is ready to use for company performance reports, business strategy presentations, management status analysis, and various corporate presentations. The light gray background keeps focus on the data visualization, making it an effective tool for data-driven business presentations.
Usage Points
-
Main Usage
Optimized for visually comparing two data items such as business progress, performance metrics, and management status analysis. The bar length intuitively conveys numerical differences while labels simultaneously display exact data values, making it ideal for quantitative comparisons.
-
How to Use
Use in company performance reports, business plan presentations, quarterly management reviews, and strategy execution evaluations to compare two versions, departments, or time periods. The slide is designed for easy editing—simply input your numerical data and the bar lengths adjust automatically to reflect the values.
-
Recommended For
Recommended for executives, business managers, project leaders, marketing teams, and sales departments who need quantitative performance analysis and comparative evaluation. Particularly suitable for quarterly or annual performance comparisons, departmental goal achievement assessments, and strategic execution reports.
-
Slide Structure
Consists of 2 slides with identical horizontal bar chart layouts. Each slide features section titles ('Contemporary Colors' and 'Sleek Diagram & chart') with two horizontal bars below (black 60 vs. red 40 / black 35 vs. red 80). The light gray background is consistent throughout, ensuring focus on data presentation.
Related Products
-

Strategic Goal Progress Template
#Business Strategy #Diagram #Graph
-

Market Analysis Chart for Frequently Used Transportation Methods When Traveling
#Business Strategy #Market and Competitor Analysis #Graph
-

Square Frame Presentation Template – Vertical Bar Chart
#Business Strategy #Graph #Achievements
-

Results of Preference Survey by Beer Product – Utilizing Horizontal Bar Graph
#Business Strategy #Financial Plans and Performance #Graph
