Linear Diagram for Effective Visualization of Business Progress
RJ0600039_15
- Last Update 07/01/2025
- File Size 2.7MB
- # of Slides 2
- File Format PPTX
- Slide Ratio 16:9
- Color
Keywords
About the Product
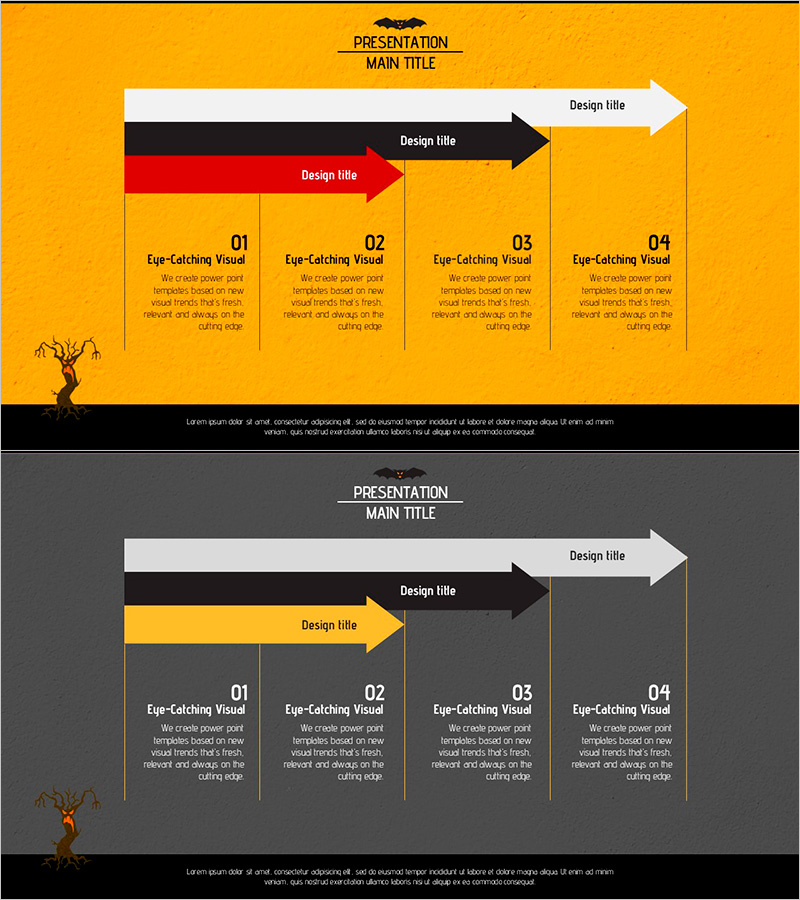
A 3-stage linear diagram PowerPoint slide that clearly presents business progress and sequential processes. White, black, and red arrows flow progressively to visualize step-by-step advancement, with four detail input areas beneath each stage for additional information. The orange background contrasted with a black footer section creates strong visual emphasis, while a decorative tree illustration on the left enhances presentation completeness. The 2-slide set includes background color variations (orange and gray), making it immediately applicable to diverse presentation scenarios.
Usage Points
-
Main Usage
Optimized for expressing business processes in chronological order and stages. Ideal for communicating project timelines, business development phases, marketing campaign schedules, product development roadmaps, and other sequential processes to audiences with clarity and visual impact.
-
How to Use
Enter stage-specific details (objectives, activities, outcomes, key metrics) in the four areas below each arrow node. Use the background color variations (orange and gray) to create section breaks or emphasis effects. The left-side illustration can be deleted or modified as needed.
-
Recommended For
Recommended for business planning teams, project managers, marketing professionals, and executives preparing progress reports. Effective for business plans, progress reports, strategy presentations, investor pitches, and project kickoff meetings where staged advancement needs clear explanation.
-
Slide Structure
Linear flow composed of three arrow nodes (white→black→red) representing progression stages. Four text input areas (labeled 01–04) positioned below each node for detailed information entry. The 2-slide set maintains identical layout with background color variations (orange/gray).
Related Products
-

Diagram Slide Connecting Business Strategy
#Business Strategy #Diagram #Implementation Framework
-

Linear Diagram Slide for Design Progress and Planning
#Business Strategy #Diagram #Implementation Framework
-

Visualizing Systematic Learning Methods
#Business Strategy #Diagram #Implementation Framework
-

Stylish PowerPoint for Visualizing Business Processes
#Business Strategy #Diagram #Implementation Framework
