Summary Table of Energy Saving Outcomes
RB0500015_9
- Last Update 03/13/2025
- File Size 2.2MB
- # of Slides 2
- File Format PPTX
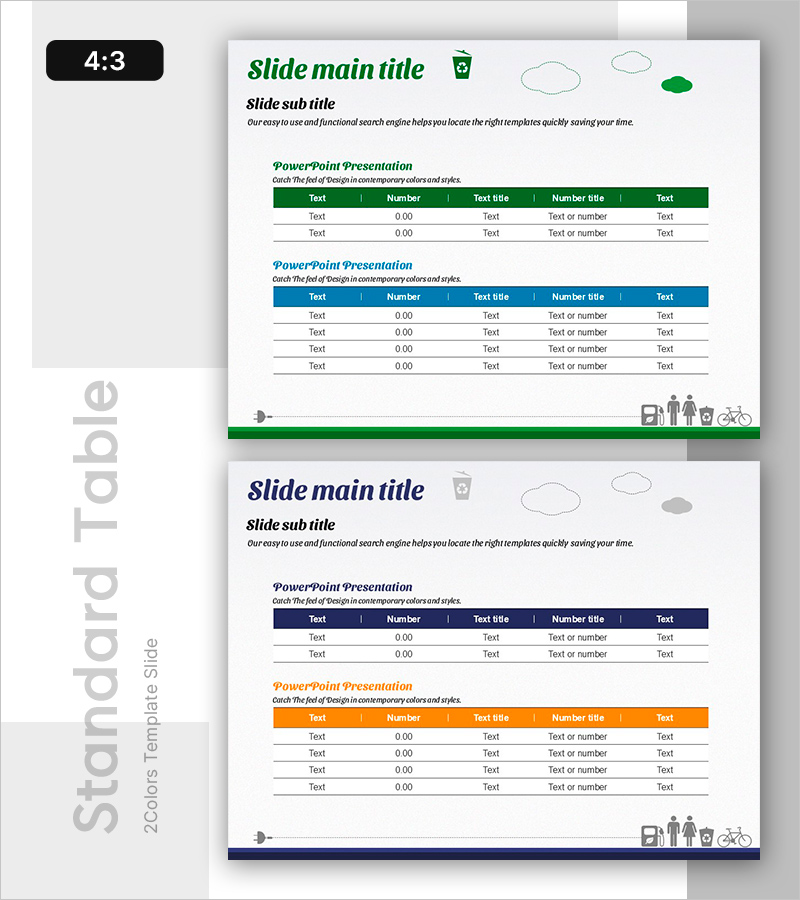
- Slide Ratio 4:3
- Color
Keywords
- #Content-Based Slides
- #Design-Based Slides
- #Market and Competitor Analysis
- #Financial Plans and Performance
- #Diagram
- #Market Analysis
- #Tax Strategy and Benefits
- #Table
- #Standard Table
- #4:3
- #data table PowerPoint slide
- #comparison table template
- #5-column slide design
- #performance summary PPT
- #information table download
About the Product
A 2-slide PowerPoint presentation template for organizing energy saving outcomes and performance data. Features two horizontal information tables with green and blue headers, each containing 5 columns for text, numbers, and item titles. The first table includes 3 data rows, the second includes 4 rows, allowing flexible data entry and comparison. Unified design with footer icons and accent bars works seamlessly for financial reports, market analysis, performance summaries, and business presentations. Delivered in 4:3 ratio PPTX format, fully editable in all PowerPoint versions.
Usage Points
-
Main Usage
Organize and compare energy savings metrics, financial indicators, or market analysis data across 5 categories in a clear, structured format. The dual-header design (green and blue) helps distinguish between different data sets while maintaining visual consistency.
-
How to Use
Simply replace placeholder text with your data in each column and row. Adjust row counts, column widths, and colors as needed to match your presentation style. The template structure remains intact for easy editing.
-
Recommended For
Finance and accounting teams presenting quarterly or annual performance reports, marketing departments analyzing market trends, executive briefings, business plan data sections, and sustainability or energy management presentations.
-
Slide Structure
2-slide layout: Slide 1 features a green-header 5-column table with 3 data rows; Slide 2 features a blue-header 5-column table with 4 data rows. Both include text, number, and title input fields, with footer icons and accent bars for visual unity.
Related Products
-

Yellow Mint Table Chart
#Market and Competitor Analysis #Financial Plans and Performance #Diagram
-

Market Trend Analysis Charts & Tables – The Power of Data Visualization
#Market and Competitor Analysis #Diagram #Graph
-

Performance Analysis Pie Chart – Market Share Visualization
#Market and Competitor Analysis #Diagram #Graph
-

Analysis Slide for Number of Caught Not Wearing Seatbelts
#Market and Competitor Analysis #Risk Management and Regulatory Compliance #Diagram
