Analysis Slide for Number of Caught Not Wearing Seatbelts
RJ0800023_10
- Last Update 08/05/2025
- File Size 0.7MB
- # of Slides 2
- File Format PPTX
- Slide Ratio 16:9
- Color
Keywords
- #Content-Based Slides
- #Design-Based Slides
- #Market and Competitor Analysis
- #Risk Management and Regulatory Compliance
- #Diagram
- #Market Analysis
- #Legal and Regulatory Compliance
- #Table
- #Standard Table
- #16:9
- #seatbelt compliance analysis PowerPoint
- #data comparison table slide
- #safety statistics presentation
- #risk management slide template
- #traffic safety report template
About the Product
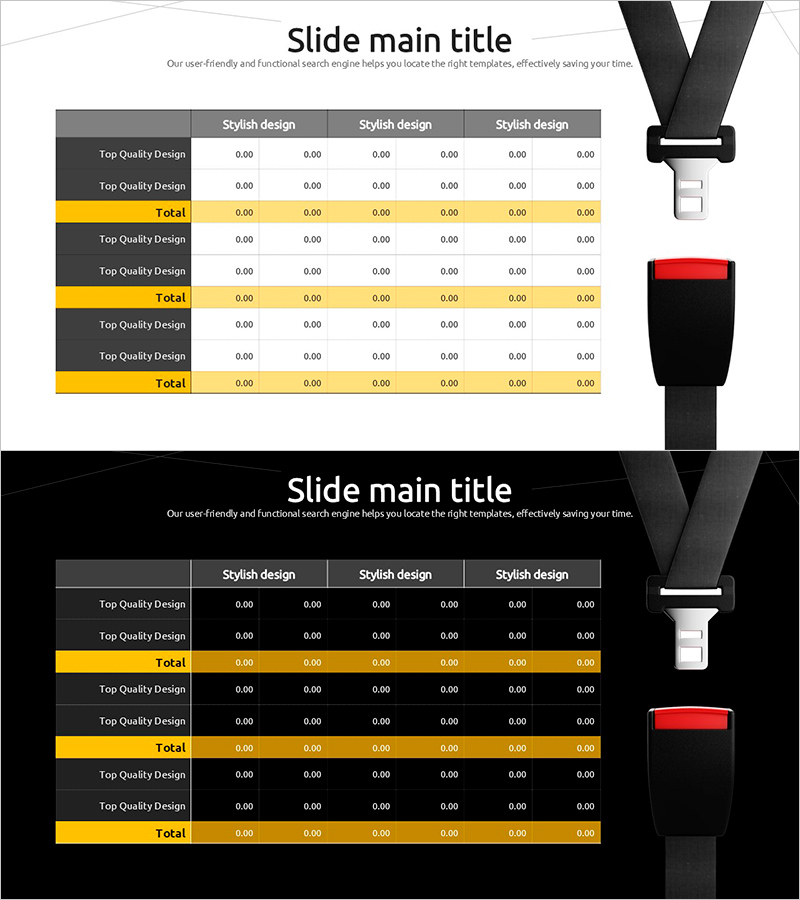
A PowerPoint slide template for analyzing seatbelt non-compliance detection counts with a structured table format. The slide features a gray header row and yellow highlight rows that organize data across three sections, each containing multiple data points across six columns. This design enables clear comparison of safety statistics and is ready for immediate use in risk management and safety policy presentations. Provided in 16:9 PPTX format with fully editable text and numerical fields.
Usage Points
-
Main Usage
Visualize seatbelt non-compliance detection data in a structured table format to communicate safety management status clearly. The three-section hierarchical structure is optimized for period-by-period, regional, and category-based comparative analysis, with yellow highlight rows that intuitively distinguish subtotals and grand totals.
-
How to Use
Use in safety policy presentations, risk management reports, traffic safety seminars, and corporate safety training materials. Replace placeholder numerical data with actual statistics and customize rows and columns to match your organization's specific safety metrics and reporting requirements.
-
Recommended For
Safety officers, risk management professionals, traffic safety policy coordinators, corporate safety training specialists, and insurance risk analysis teams presenting safety statistics and violation detection data. Suitable for government agencies, corporations, and educational institutions conducting safety-related presentations.
-
Slide Structure
Two-slide set offering both light and dark background versions. Each slide contains a title area, three data sections with tables (each section has two data rows plus one subtotal row), and six columns for numerical input. The three-tier color scheme—gray header, black data rows, and yellow subtotal rows—clearly establishes information hierarchy and facilitates data comparison.
Related Products
-

Status Analysis Donut Chart – Shareholder Status Analysis
#Company Introduction #Market and Competitor Analysis #Diagram
-

Visualizing Market Analysis and Performance with Reading Learning Table Charts
#Market and Competitor Analysis #Financial Plans and Performance #Diagram
-

Shareholder Status Analysis Slide – Data-Driven Market Insights
#Company Introduction #Market and Competitor Analysis #Diagram
-

Shareholder Status Analysis Chart & Description – Sleek Diagram
#Company Introduction #Market and Competitor Analysis #Diagram
