Triangle Pattern Visualization of Business Performance – Simple Table Chart
RJ0200005_13
- Last Update 03/29/2025
- File Size 0.1MB
- # of Slides 2
- File Format PPTX
- Slide Ratio 16:9
- Color
Keywords
- #Content-Based Slides
- #Design-Based Slides
- #Financial Plans and Performance
- #Diagram
- #Cash Flow Statement
- #Tax Strategy and Benefits
- #Table
- #Standard Table
- #16:9
- #table chart PowerPoint
- #table slide template
- #data table presentation
- #3-column table design
- #financial performance table slide
- #business data visualization
About the Product
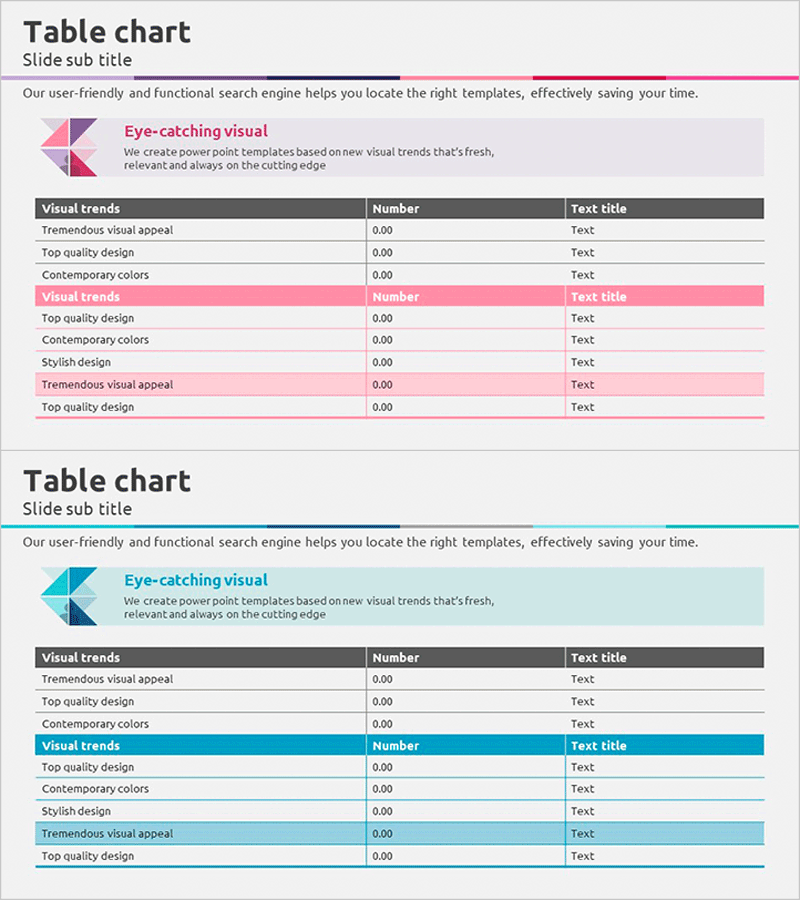
A PowerPoint slide template for organizing business performance and financial data in a structured 3-column table format. Features pink and gray highlighted rows to clearly distinguish information sections and improve visual hierarchy. Two color scheme versions are included: the first slide emphasizes pink accents, while the second uses teal accents, allowing you to select based on your presentation tone. Each row contains three columns—item name, numeric value, and text description—optimized for visual comparison and data organization. Instantly applicable to reports, business proposals, and presentations when displaying performance metrics, cost breakdowns, project status, or financial summaries.
Usage Points
-
Main Usage
Presents quantitative data such as business performance, financial metrics, cost items, and project status in a structured table format to enhance audience comprehension. Highlighted rows create clear information hierarchy by section, making it highly effective for comparative data visualization and analysis.
-
How to Use
Use in business reports, investor presentations, executive briefings, and marketing plans to display performance metrics, budget status, and market data in table format. Edit each row's text to input item names, numeric values, and descriptions, then select the color version that matches your document's tone.
-
Recommended For
Ideal for CFOs, finance professionals, executives, marketing managers, and project managers who need to communicate quantitative data clearly and effectively. Particularly useful for quarterly performance reviews, budget execution tracking, KPI dashboards, and market share analysis.
-
Slide Structure
2-slide set. Each slide features a multi-row table with 3 columns (item, value, description) and header rows distinguished by pink or teal highlighting. Optimized for 16:9 widescreen format with fully editable text and cell colors for customization.
Related Products
-

Circular Gradient Table – Financial Performance and Differentiation
#Financial Plans and Performance #Diagram #Balance Sheet
-

Visualize Market Trends and Cash Flow with Area Charts!
#Market and Competitor Analysis #Financial Plans and Performance #Graph
-

Business Plan PowerPoint Design – Excel Table Utilization
#Financial Plans and Performance #Diagram #Balance Sheet
-

Green & Gray Template Wide Table – Visualizing Financial Plans and Performance
#Financial Plans and Performance #Diagram #Cash Flow Statement
