100% Stacked Column Chart by Subject – Effective Market Analysis
RJ0500027_12
- Last Update 06/14/2025
- File Size 0.9MB
- # of Slides 2
- File Format PPTX
- Slide Ratio 16:9
- Color
Keywords
- #Content-Based Slides
- #Design-Based Slides
- #Market and Competitor Analysis
- #Diagram
- #Graph
- #Market Analysis
- #Table
- #Column
- #Standard Table
- #Segmented Column
- #16:9
- #100% stacked column chart
- #stacked bar chart PowerPoint
- #4-series comparison slide
- #market analysis presentation
- #data visualization PowerPoint template
About the Product
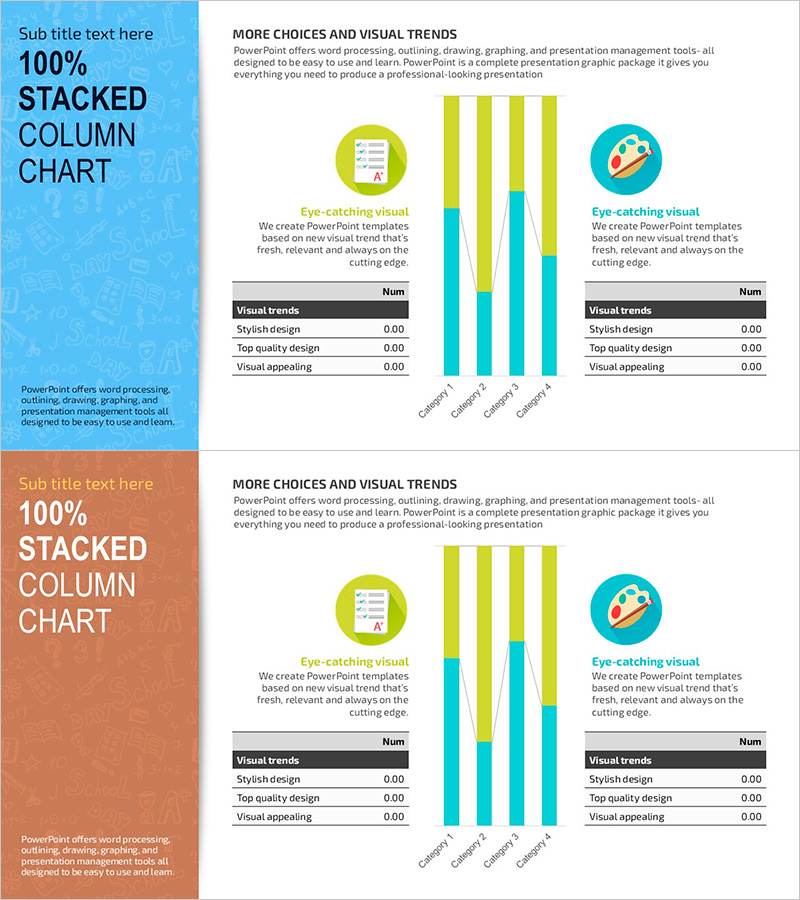
A 100% stacked column chart PowerPoint slide comparing four data series side by side. The design uses lime, cyan, and blue gradient colors to clearly distinguish each series, with icons and descriptive text at the top to enhance visual context. Perfect for market analysis, product comparison, and departmental performance evaluation in presentations. The 16:9 widescreen format includes 2 fully editable slides ready for immediate use.
Usage Points
-
Main Usage
Displays the composition ratio of multiple categories simultaneously while showing each series' share relative to the total. Designed to clearly present market share, product sales composition, departmental budget allocation, and customer segment analysis at a glance.
-
How to Use
Each column is divided into 4 color-coded series with clear visual separation. The top section features icons and 'More Choices and Visual Trends' text to emphasize the slide theme, while a data table at the bottom provides numerical support. You can freely modify the number of series and data values to match your presentation needs.
-
Recommended For
Marketing professionals, executives, analysts, and consultants will find this ideal for quarterly performance reports, market research presentations, and product portfolio analysis. Particularly effective in strategy meetings and investor presentations where multi-category data comparison by percentage is required.
-
Slide Structure
2-slide set. Each slide features a blue-background title area on the left (100% STACKED COLUMN CHART) and a white-background chart area on the right. The chart contains 4 stacked columns in 4 series (lime, cyan, blue, dark blue), with 2 icons and descriptive text above and a visual trends data table below.
Related Products
-

Big Data Market Analysis Graph – Trends and Performance
#Market and Competitor Analysis #Financial Plans and Performance #Diagram
-

Subdivided Bar Graph for Visual Market Analysis – Presenting Competitive Data Effectively
#Market and Competitor Analysis #Diagram #Graph
-

Market Analysis Segmented Bar Graph & Table Chart – Visualization of Competitive Analysis
#Market and Competitor Analysis #Diagram #Graph
-

Subdivided Graphs and Tables Slide – Market Analysis and Performance Data
#Market and Competitor Analysis #Financial Plans and Performance #Diagram
