Energy Saving Performance by Year – Performance and Market Trends
RB0500015_8
- Last Update 03/13/2025
- File Size 2.2MB
- # of Slides 2
- File Format PPTX
- Slide Ratio 4:3
- Color
Keywords
About the Product
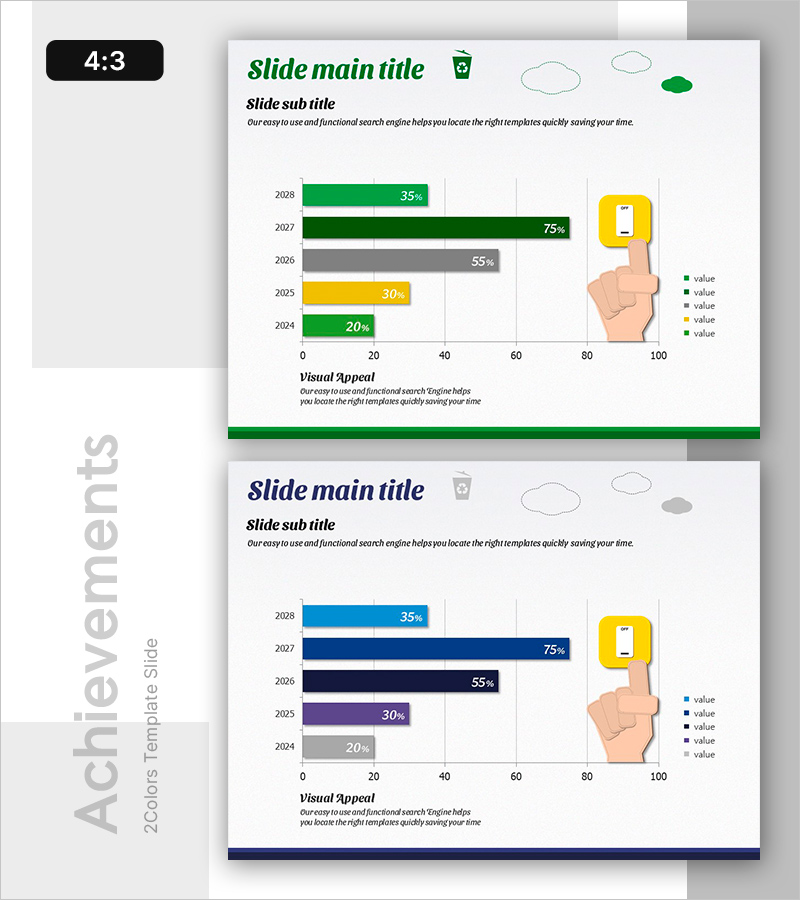
A PowerPoint slide visualizing annual energy saving performance across a 5-year timeline using horizontal bar charts. The design features green and blue color schemes to clearly represent year-over-year performance percentages, with a pointing hand illustration on the right for visual emphasis. Includes title, subtitle, descriptive text areas, and a legend for immediate use in business performance presentations, market trend analysis, and competitive benchmarking. Available in 4:3 aspect ratio PPTX format for seamless integration into existing presentations.
Usage Points
-
Main Usage
Clearly communicate annual energy conservation achievements through numerical data and percentage comparisons, enabling stakeholders to quickly grasp performance trends over time. Suitable for executive performance reports, market trend analysis documents, and management briefing materials.
-
How to Use
Edit the title and subtitle fields to match your presentation topic, then customize the legend items to reflect your data categories. Update the bar chart values and colors to represent your actual performance metrics, and the slide is ready for immediate presentation use.
-
Recommended For
Energy and environmental companies presenting business performance, government agencies analyzing policy effectiveness, consulting firms delivering market trend reports, and investor presentations highlighting performance achievements.
-
Slide Structure
Top section with title and subtitle (2 text areas) + central 5-year horizontal bar chart (2028–2024 data with 5 bars) + right-side pointing hand illustration + legend with 5 items + bottom Visual Appeal descriptive text.
Related Products
-

Comparison Graph of Business Trends by Year – Performance and Market Trends
#Business Strategy #Market and Competitor Analysis #Graph
-

Green Red Year Bundled Graph
#Business Strategy #Market and Competitor Analysis #Graph
-

Horizontal Bar Chart for Annual Coffee Consumption – Business Strategy
#Business Strategy #Market and Competitor Analysis #Graph
-

Analysis of Comparative Graphs by Year – Clear Visualization of Market Trends
#Business Strategy #Market and Competitor Analysis #Graph
