Annual Momentum Record – Visualization of Achievements
RJ0800044_24
- Last Update 08/12/2025
- File Size 1.2MB
- # of Slides 2
- File Format PPTX
- Slide Ratio 16:9
- Color
Keywords
- #Content-Based Slides
- #Design-Based Slides
- #Business Strategy
- #Market and Competitor Analysis
- #Graph
- #Achievements
- #Industry Trends
- #Line
- #Line Chart
- #16:9
- #line chart PowerPoint slide
- #3-series trend graph
- #annual performance visualization
- #multi-line data chart template
- #how to create line chart in PowerPoint
About the Product
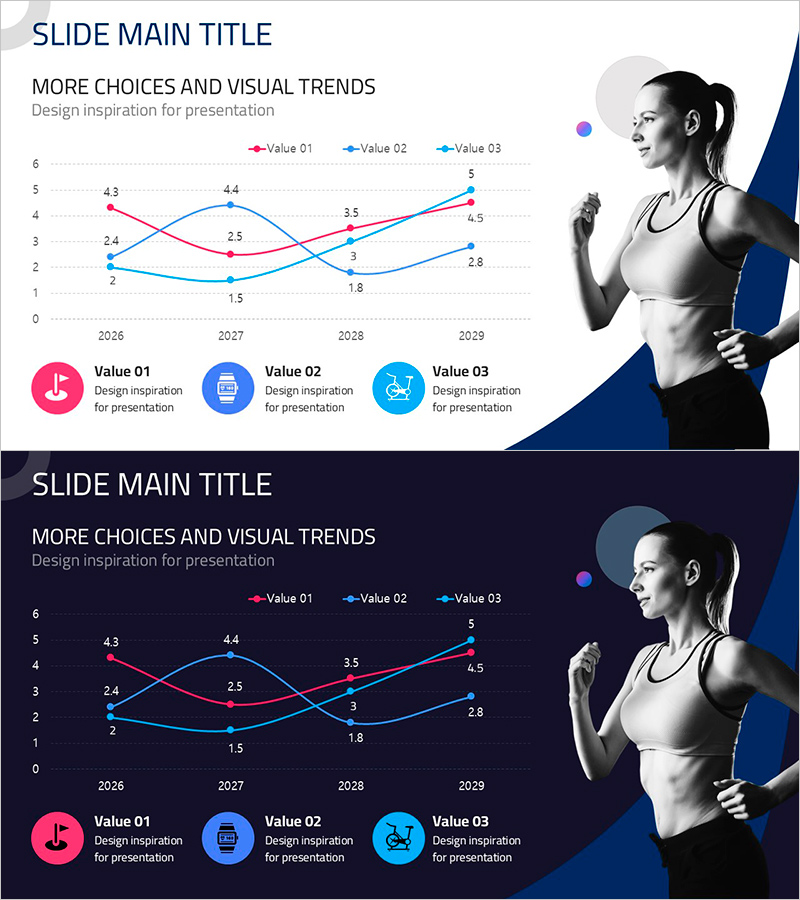
A multi-series line chart PowerPoint slide that visualizes annual momentum records and performance trends across four years (2026–2029). Three data lines in pink, blue, and cyan represent different metrics, with precise numerical data points marked at each interval. Two design options—light background and dark background—are included to match any presentation environment. Ideal for business reports, competitive analysis, market trend presentations, and performance dashboards where tracking multiple metrics over time is essential.
Usage Points
-
Main Usage
Designed to compare three key performance indicators (KPIs) over a four-year period, such as annual revenue, customer satisfaction scores, or market share trends. The intersecting lines and upward/downward trajectories enable stakeholders to quickly identify performance patterns and make data-driven decisions.
-
How to Use
Double-click the numerical data points (2.4, 4.3, 4.4, etc.) to replace them with your actual figures. Customize the three line colors and legend labels (Value 01, 02, 03) to match your data categories. Select either the light or dark background version based on your presentation theme and venue.
-
Recommended For
Executive dashboards, marketing team campaign performance reviews, sales quarterly results presentations, consulting firm client analysis reports, and academic presentations requiring multi-variable trend comparison across departments and industries.
-
Slide Structure
Two-slide set. Each slide features a central 3-series line chart spanning 2026–2029, with legend and icons positioned at the bottom. A female silhouette image on the left and dark blue geometric shape on the right provide visual balance. Both light and dark background color schemes are provided for flexible presentation use.
Related Products
-

System Efficiency Growth – Market Analysis and Business Strategy
#Business Strategy #Market and Competitor Analysis #Graph
-

Market Overview and Growth Trend – Strategic Data Analysis
#Business Strategy #Market and Competitor Analysis #Diagram
-

Competitor Analysis Broken Line Graph – Market Trends and Vision
#Market and Competitor Analysis #Graph #Competitor Analysis
-

Market Trends and Competitor Analysis Chart – Emphasizing Future Outlook
#Market and Competitor Analysis #Graph #Future Outlook
