Sales Trends Over the Past Four Years - Graph for Market Analysis and Achievements
RJ0900010_20
- Last Update 08/18/2025
- File Size 4.4MB
- # of Slides 2
- File Format PPTX
- Slide Ratio 16:9
- Color
Keywords
- #Content-Based Slides
- #Design-Based Slides
- #Business Strategy
- #Market and Competitor Analysis
- #Graph
- #Achievements
- #Industry Trends
- #Horizontal Bar
- #Segmented Horizontal Bar
- #16:9
- #4-year sales chart
- #horizontal bar graph PowerPoint
- #sales trend presentation
- #market analysis slide
- #performance comparison chart
- #annual revenue visualization
About the Product
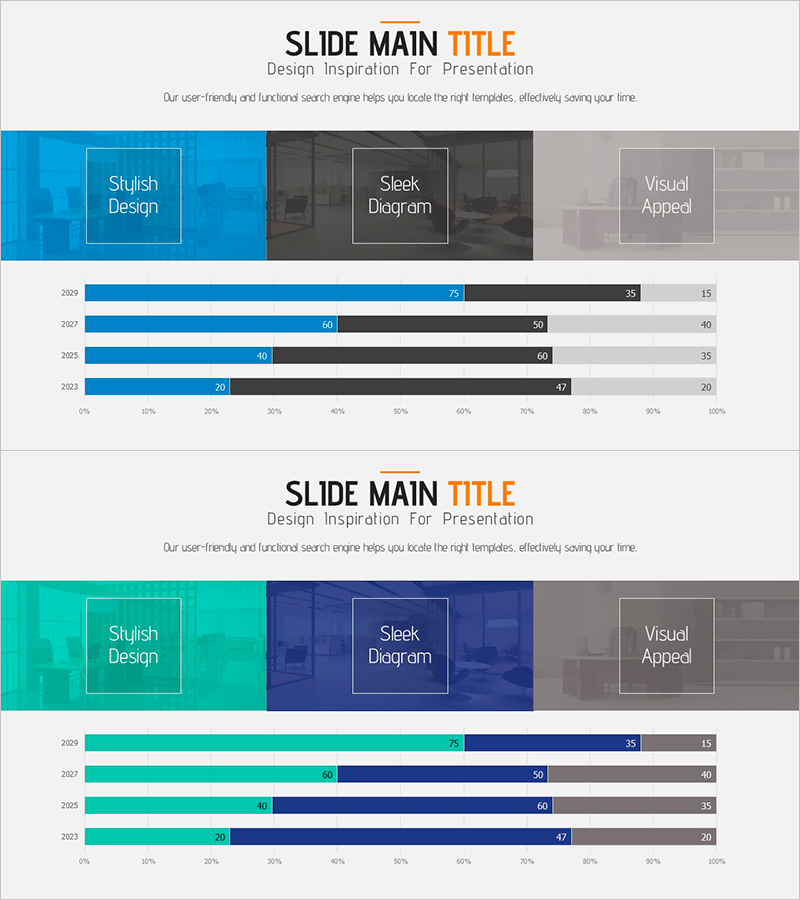
A horizontal bar chart PowerPoint slide comparing four years of sales performance across three data series. The blue, dark gray, and light gray color scheme clearly visualizes year-over-year revenue changes and performance metrics. This presentation slide is ready to use in business performance reports, market analysis documents, and investor presentations. The 16:9 aspect ratio and 2-slide format adapt seamlessly to various presentation environments and editing needs.
Usage Points
-
Main Usage
This chart slide enables side-by-side comparison of multi-year revenue data and multiple data series at a glance. It effectively communicates growth trends and performance metrics in business reports, investor pitches, and market analysis presentations.
-
How to Use
Insert this slide into the performance analysis section of your report or the financial results page of investor materials. Edit the bar values to reflect actual revenue data, and adjust colors and legend labels to match your corporate branding guidelines.
-
Recommended For
Finance managers, executives, and marketing teams presenting quarterly or annual performance results will find this slide invaluable. It works well in business plans, executive reports, investor presentations, and market analysis decks where data credibility is essential.
-
Slide Structure
The 2-slide set features a horizontal bar chart with three data series (blue, dark gray, light gray) on the first slide and an alternative view of the same data on the second. Each year displays three bars side by side for easy series comparison, with numerical labels clearly visible for reference.
Related Products
-

Accumulated Horizontal Graphs Inside Nature – Market Trend Analysis
#Business Strategy #Market and Competitor Analysis #Graph
-

100% Stacked Column Chart Slide – Performance and Market Trends
#Business Strategy #Market and Competitor Analysis #Graph
-

Comparison Graph of Business Trends by Year – Performance and Market Trends
#Business Strategy #Market and Competitor Analysis #Graph
-

Horizontal Bar Chart for Annual Coffee Consumption – Business Strategy
#Business Strategy #Market and Competitor Analysis #Graph
