Global Market Analysis Chart – Market Trends and Data Visualization
RB0100052_6
- Last Update 03/06/2025
- File Size 1.2MB
- # of Slides 2
- File Format PPTX
- Slide Ratio 4:3
- Color
Keywords
- #Content-Based Slides
- #Design-Based Slides
- #Company Introduction
- #Market and Competitor Analysis
- #Graph
- #Other
- #Global Network
- #Market Analysis
- #Circles
- #Doughnut Chart
- #Map
- #4:3
- #world map PowerPoint slide
- #global market analysis presentation
- #map-based data visualization
- #donut chart slide template
- #market trends infographic
About the Product
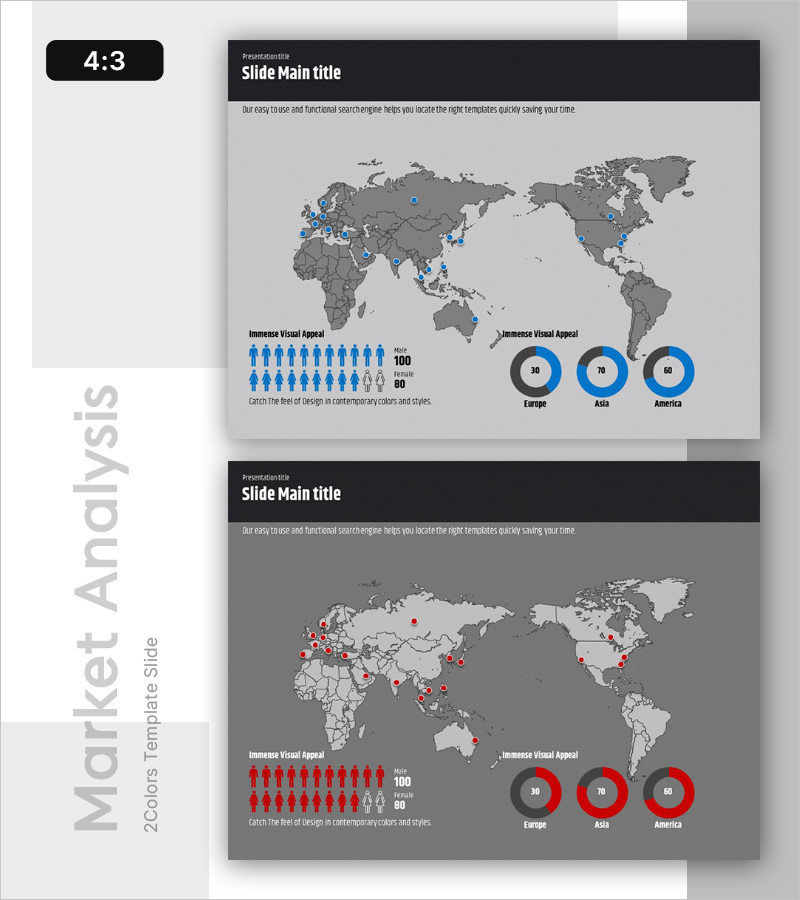
A world map-based PowerPoint slide for visualizing global market expansion strategy. The light gray world map features blue location markers highlighting key business hubs, demographic data represented through icons, and regional performance comparison using three donut charts. This 2-slide set provides both blue and red color versions on identical layouts, allowing you to select the appropriate version based on presentation context. Instantly applicable for international business presentations, market research reports, and competitive analysis discussions.
Usage Points
-
Main Usage
Designed to communicate international market expansion strategy, global hub distribution, and regional sales or customer ratio at a glance. Location markers on the world map indicate key business sites, while three donut charts compare regional performance across Europe, Asia, and America with numerical data.
-
How to Use
Use in investor presentations, executive briefings, and market research reports to explain global expansion status. The blue version conveys confidence and positive outlook, while the red version signals caution or areas requiring attention—select the appropriate version based on your presentation objective.
-
Recommended For
International business managers, marketing strategy teams, management consultants, market research analysts, and investor relations professionals presenting global market status and regional performance to executives, investors, and business partners.
-
Slide Structure
Slide 1: Gray world map with approximately 15 blue location markers, demographic icons (100 male, 80 female figures), and three donut charts (Europe 30%, Asia 70%, America 60%). Slide 2: Identical layout with red markers and charts for contrast. 4:3 aspect ratio, PPTX format.
Related Products
-

Global Network Market Trends – Insights through Data Visualization
#Company Introduction #Market and Competitor Analysis #Graph
-

Regional Demand Survey Graph – Key to Market Analysis
#Market and Competitor Analysis #Financial Plans and Performance #Graph
-

Global Market Snapshot – Market Analysis and Outlook
#Company Introduction #Market and Competitor Analysis #Diagram
-

Forest Illustration Global Map – Visualizing Market Analysis
#Company Introduction #Market and Competitor Analysis #Other
