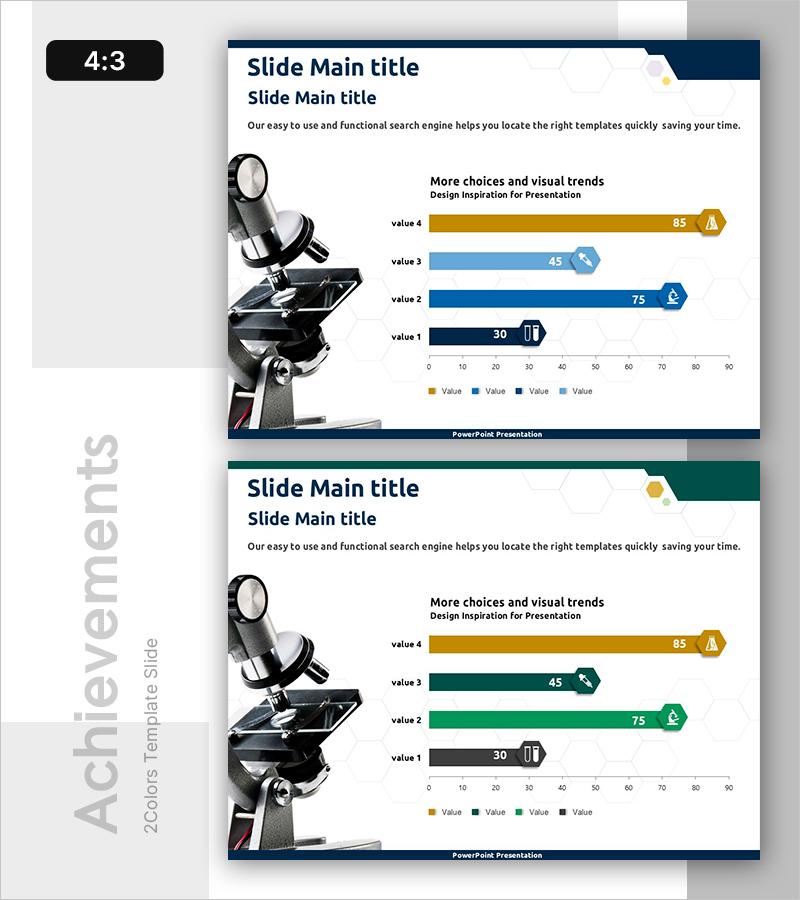
Horizontal Bar Graph of Component Analysis Results
RB0400019_5
- Last Update 03/12/2025
- File Size 0.6MB
- # of Slides 2
- File Format PPTX
- Slide Ratio 4:3
- Color
Keywords
- #Content-Based Slides
- #Design-Based Slides
- #Business Strategy
- #Market and Competitor Analysis
- #Graph
- #Achievements
- #Competitive Advantage
- #Horizontal Bar
- #Horizontal Bar Chart
- #4:3
- #horizontal bar chart PowerPoint
- #component analysis slide
- #4-series bar graph
- #data comparison PPT
- #numerical visualization slide
About the Product
A PowerPoint slide that visualizes component analysis results using a 4-series horizontal bar chart. Each item's numerical values and relative size differences are displayed intuitively with four distinct colors: gold, light blue, dark blue, and steel blue. The chart includes a clear horizontal axis ranging from 0 to 90 with precise data labels for immediate presentation use. The 2-slide set allows you to present multiple analysis results, formatted in 4:3 ratio PPTX compatible with all PowerPoint versions for easy editing and customization.
Usage Points
-
Main Usage
This slide presents numerical data across components, elements, or items using a horizontal bar chart format. The 4-series color differentiation enables simultaneous display of multiple datasets, clearly communicating relative sizes and rankings of each item. Ideal for market analysis, competitive advantage comparisons, and business strategy presentations where key metrics need emphasis.
-
How to Use
Replace the four bar series and numerical labels with your own data values. Maintain the gold, light blue, dark blue, and steel blue color scheme or adapt to your corporate brand colors. Adjust the horizontal axis scale (0–90) to match your data range, then add titles and legends to align with your presentation context.
-
Recommended For
Marketing professionals, strategy planners, sales managers, data analysts, and executives presenting component comparisons, market share analysis, product performance metrics, or competitive benchmarking. Suitable for business plans, market analysis reports, product presentations, and executive briefings.
-
Slide Structure
2-slide set with title area, 4-series horizontal bars (value 1–4), numerical labels, legend, and horizontal axis (0–90) on each slide. Bar length represents numerical values, with category icons positioned to the right of each bar for visual emphasis. Optimized for 4:3 aspect ratio, ensuring compatibility with projectors and screen sharing.
Related Products
-

Eco-friendly Icon Bar Graph – Effective Visualization for Market Analysis
#Business Strategy #Market and Competitor Analysis #Graph
-

Bar Chart Analysis of Gardening Activities Trend – Performance and Competitive Advantage
#Business Strategy #Market and Competitor Analysis #Diagram
-

Market Analysis Chart for Frequently Used Transportation Methods When Traveling
#Business Strategy #Market and Competitor Analysis #Graph
-

Performance Analysis of the Second-Ranked Item – Towards Successful Strategies
#Business Strategy #Market and Competitor Analysis #Graph
