Formulation Component Analysis of the Drug Slide – Effective Data Visualization
RB0400015_4
- Last Update 03/12/2025
- File Size 2MB
- # of Slides 2
- File Format PPTX
- Slide Ratio 4:3
- Color
Keywords
- #Content-Based Slides
- #Design-Based Slides
- #Product/Service Introduction
- #Market and Competitor Analysis
- #Graph
- #Composition
- #Market Share
- #Circles
- #Doughnut Chart
- #4:3
- #donut chart PowerPoint slide
- #pie chart template
- #ratio analysis graph
- #component visualization
- #how to create donut chart in PowerPoint
About the Product
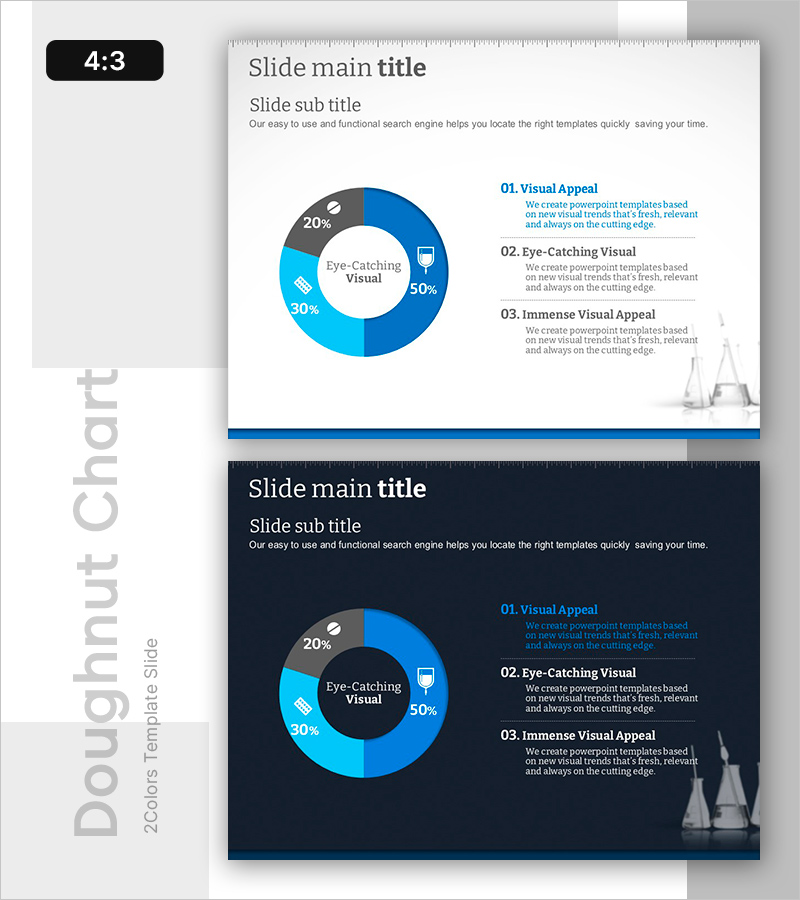
A donut chart PowerPoint slide divided into 4 segments with gradient shades of navy, light blue, and gray. The hollow center area allows you to place key messages or core metrics, making it ideal for presenting component composition, market share, budget allocation, and other proportional data. This template is ready to use for pharmaceutical formulation analysis, financial breakdowns, and comparative presentations. The 2-slide set includes both light and dark background versions for flexible presentation environments.
Usage Points
-
Main Usage
Display the proportion of each component relative to the whole, such as product formulation breakdown, market share distribution, budget allocation, or sales ratio. The hollow center emphasizes key metrics or messages, drawing audience attention to critical data points.
-
How to Use
Edit the chart segments by entering your data values; proportions update automatically. Customize colors, labels, and legend text to match your presentation theme. Use the light background slide for general meetings and training; select the dark background for premium client presentations and executive briefings.
-
Recommended For
Pharmaceutical and medical professionals presenting drug formulation analysis, marketing teams reporting market share, finance teams explaining budget composition, sales teams introducing product portfolios, and executives presenting business unit performance in annual reports.
-
Slide Structure
2-slide layout. Each slide features a 4-segment donut chart as the focal point with 3 descriptive text blocks positioned to the right. Slide 1 uses a light gray background with blue-toned chart; Slide 2 features a dark navy background with bright blue chart for visual contrast.
Related Products
-

Visualizing Major Plant Composition with Donut Chart
#Product/Service Introduction #Market and Competitor Analysis #Graph
-

Doughnut Chart Slide for Crop Growing Items
#Product/Service Introduction #Market and Competitor Analysis #Graph
-

The Proportion and Characteristics of Composed Flowers – Engaging Infographic Slide
#Product/Service Introduction #Market and Competitor Analysis #Diagram
-

Sales Status by Donut Product Visualization – Attractive Graph Design
#Product/Service Introduction #Market and Competitor Analysis #Graph
