The Proportion and Characteristics of Composed Flowers – Engaging Infographic Slide
RJ0800011_23
- Last Update 08/02/2025
- File Size 0.9MB
- # of Slides 2
- File Format PPTX
- Slide Ratio 16:9
- Color
Keywords
- #Content-Based Slides
- #Design-Based Slides
- #Product/Service Introduction
- #Market and Competitor Analysis
- #Diagram
- #Graph
- #Composition
- #Market Share
- #Cluster
- #Circles
- #Chain Diagram
- #Doughnut Chart
- #16:9
- #donut chart PowerPoint slide
- #pie chart presentation template
- #ratio visualization PPT
- #4-segment donut diagram
- #composition infographic slide
About the Product
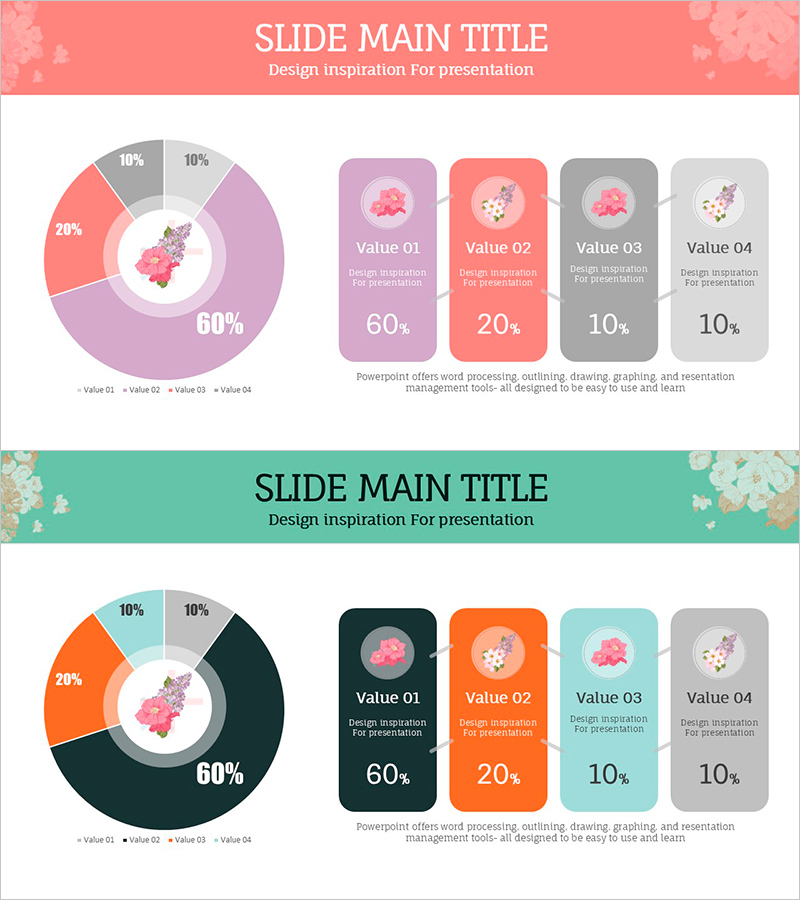
A donut chart PowerPoint slide that visualizes the proportion and characteristics of composed flowers with a 4-segment breakdown. The design features a central floral illustration surrounded by ratio data displayed as 60%, 20%, 10%, and 10% segments. Soft color palette in pink, lavender, coral, and gray tones with flower motif icons makes it ideal for presenting market share, composition ratios, and category distribution. This 2-slide presentation template is ready to use in business reports, proposals, and marketing decks with editable data fields and customizable text.
Usage Points
-
Main Usage
The donut chart clearly expresses the proportion and characteristics of each segment within the whole. The combination of central illustration and surrounding data labels achieves both visual emphasis and effective information delivery, making it ideal for marketing, sales, and planning presentations to communicate key metrics.
-
How to Use
Slide 1 combines the donut chart with 4 value cards to present ratios and descriptions simultaneously. Slide 2 allows you to restructure with different datasets or add supplementary information. Edit colors, percentages, and text to adapt to company profiles, product composition, market analysis, customer segmentation, and budget allocation scenarios.
-
Recommended For
Recommended for marketing, sales, planning, and analytics professionals presenting data-driven insights. Ideal for business plans, proposals, and reports focusing on market share, product line composition, customer distribution, budget allocation, and project progress tracking.
-
Slide Structure
Slide 1: Central donut chart (4 segments: 60%, 20%, 10%, 10%) with 4 value cards on the right (Value 01–04 with percentage and description text). Slide 2: Identical layout with alternate color scheme (turquoise, orange, dark navy, gray). Total 2 slides, 16:9 aspect ratio, PPTX format.
Related Products
-

Magic Donut Chart for Market Share Visualization – Key Information Delivery
#Product/Service Introduction #Market and Competitor Analysis #Diagram
-

Aviation Service Development Schedule Donut Circle Graph
#Product/Service Introduction #Market and Competitor Analysis #Diagram
-

Development Status Analysis Connection Diagram – Effective Information Delivery
#Product/Service Introduction #Market and Competitor Analysis #Diagram
-

Sales Status by Donut Product Visualization – Attractive Graph Design
#Product/Service Introduction #Market and Competitor Analysis #Graph
