Visualizing Major Plant Composition with Donut Chart
RJ0600099_5
- Last Update 07/18/2025
- File Size 0.9MB
- # of Slides 2
- File Format PPTX
- Slide Ratio 16:9
- Color
Keywords
- #Content-Based Slides
- #Design-Based Slides
- #Product/Service Introduction
- #Market and Competitor Analysis
- #Graph
- #Composition
- #Market Share
- #Circles
- #Doughnut Chart
- #16:9
- #donut chart PowerPoint slide
- #pie chart template download
- #composition ratio visualization
- #data comparison diagram
- #how to create donut chart in PowerPoint
About the Product
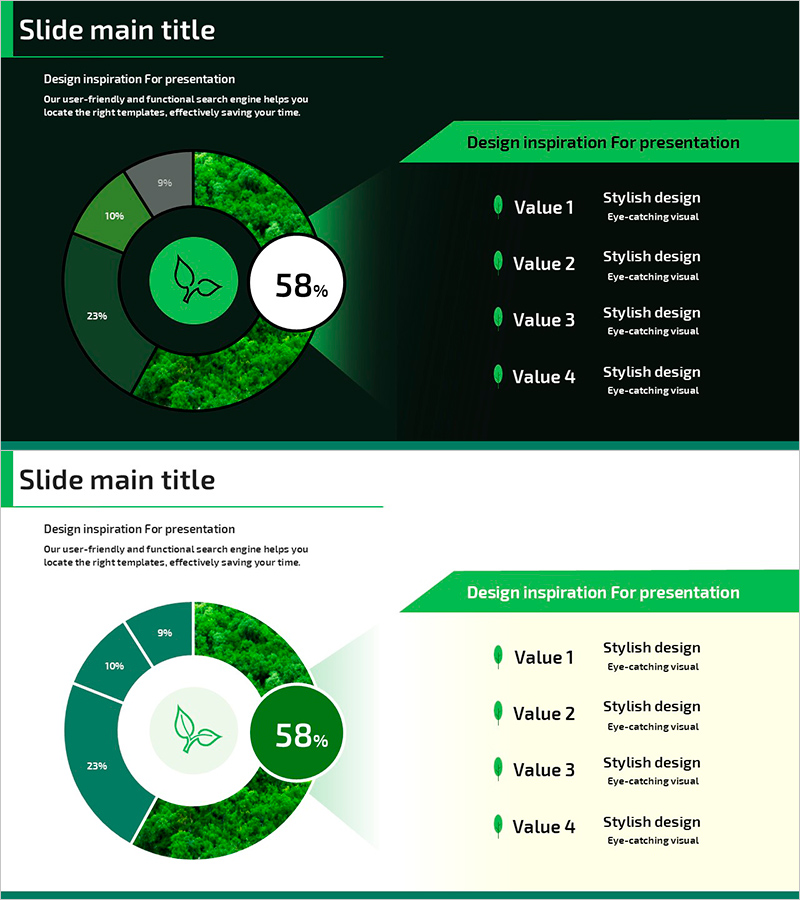
A PowerPoint slide featuring a green-toned donut chart that intuitively visualizes composition ratios. The design emphasizes the central metric (58%) while displaying four surrounding segments (23%, 10%, 9%) to represent data distribution. The textured donut area combined with a right-aligned value legend creates a balanced layout suitable for market share analysis, product portfolio breakdown, and resource allocation presentations. This 2-slide deck in 16:9 PPTX format integrates seamlessly into business reports, strategic proposals, and investor presentations.
Usage Points
-
Main Usage
The donut chart clearly expresses each segment's proportion relative to the whole. By combining a prominent central metric with surrounding segmented areas, it effectively communicates hierarchical data importance. Ideal for market analysis, product portfolio visualization, budget allocation, and customer demographic breakdowns.
-
How to Use
Insert this slide into your presentation's market overview, product composition, or customer distribution sections. Edit the donut segments' colors and percentages to match your dataset, then update the right-side value labels with your specific data points. Fully customizable for reports, strategic plans, investor decks, and quantitative analyses.
-
Recommended For
Marketing professionals, business analysts, strategists, and executives presenting market share, product lineups, customer segmentation, or budget distribution. Particularly effective in business reports, strategy presentations, investor briefings, and product overview materials where quantitative data requires visual emphasis.
-
Slide Structure
2-slide deck. Slide 1: Dark background with green donut chart (58% center emphasis, 4 segments of 23%, 10%, 9%), right-side value legend for 4 items. Slide 2: Light background with same donut structure (adjusted color tone), right-side icons with 4-item descriptions. 16:9 widescreen format optimized for modern presentation environments.
Related Products
-

The Proportion and Characteristics of Composed Flowers – Engaging Infographic Slide
#Product/Service Introduction #Market and Competitor Analysis #Diagram
-

Doughnut Chart Slide for Crop Growing Items
#Product/Service Introduction #Market and Competitor Analysis #Graph
-

Sales Status by Donut Product Visualization – Attractive Graph Design
#Product/Service Introduction #Market and Competitor Analysis #Graph
-

Formulation Component Analysis of the Drug Slide – Effective Data Visualization
#Product/Service Introduction #Market and Competitor Analysis #Graph
