Doughnut Chart Slide for Crop Growing Items
RJ0600103_7
- Last Update 07/19/2025
- File Size 0.8MB
- # of Slides 2
- File Format PPTX
- Slide Ratio 16:9
- Color
Keywords
- #Content-Based Slides
- #Design-Based Slides
- #Product/Service Introduction
- #Market and Competitor Analysis
- #Graph
- #Composition
- #Market Share
- #Circles
- #Doughnut Chart
- #16:9
- #doughnut chart PowerPoint
- #pie chart slide template
- #crop comparison presentation
- #market share visualization
- #4-section donut chart
- #agricultural presentation slides
About the Product
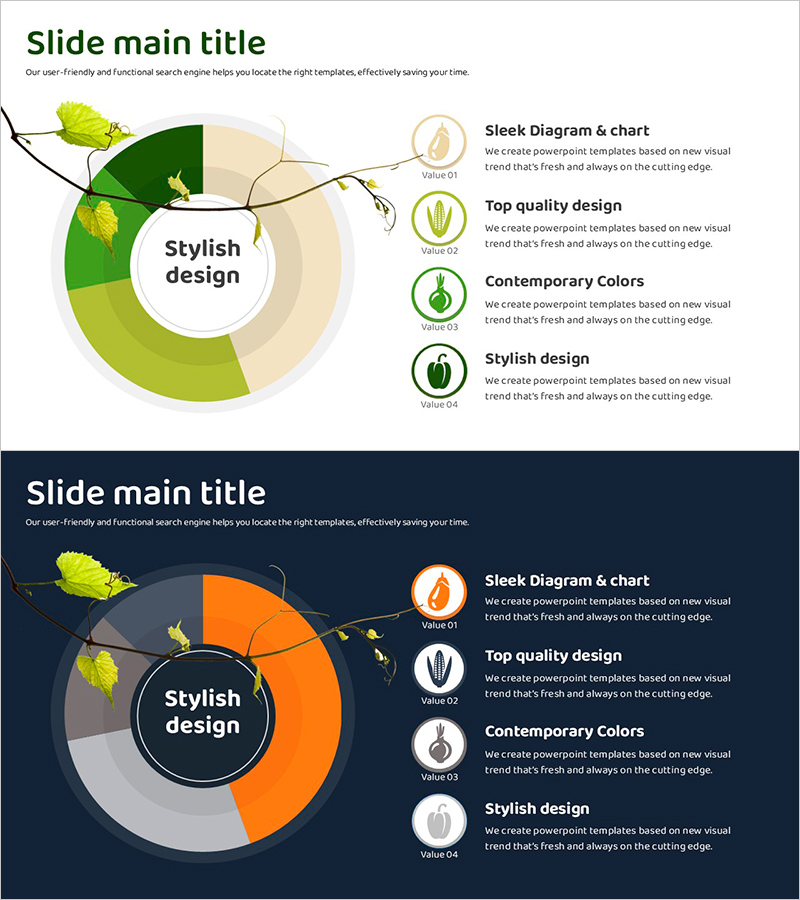
A 4-section doughnut chart PowerPoint slide designed to visualize crop production volume, market share, and sales distribution by agricultural product. The slide features a natural color palette of green, orange, and beige tones, optimized for agricultural presentations and business reports. The central circular area accommodates key messaging, while the four outer segments display data for each crop category. The right side includes icons and text descriptions to enhance information clarity. This 2-slide set provides both light and dark background versions, ensuring compatibility with various presentation environments and projection settings.
Usage Points
-
Main Usage
This slide enables side-by-side comparison and visualization of crop production volume, market share, and sales distribution by agricultural product. The central circular area emphasizes key messaging to capture audience attention. Ideal for business reports, marketing plans, and investor presentations in the agricultural sector.
-
How to Use
Input crop-specific data into the 4-section doughnut chart on the left side; proportions update automatically. Enhance the right-side icon area with crop images or descriptive text. Use the light background version for standard conference rooms and the dark background version for large-screen presentations.
-
Recommended For
Recommended for agricultural companies, produce distributors, and government agricultural agencies preparing business reports and marketing plans. Suitable for crop sales analysis, crop diversification strategy presentations, and regional cultivation status reports requiring data-driven decision-making.
-
Slide Structure
Doughnut chart positioned in the left-center area with 4 segments in green, orange, beige, and gray tones. Central circular area accepts key messaging text. Right side features 4 icons (Value 01–04) with corresponding text description fields. 2-slide set includes light background version (cream and green tones) and dark background version (navy and orange tones).
Related Products
-

Formulation Component Analysis of the Drug Slide – Effective Data Visualization
#Product/Service Introduction #Market and Competitor Analysis #Graph
-

The Proportion and Characteristics of Composed Flowers – Engaging Infographic Slide
#Product/Service Introduction #Market and Competitor Analysis #Diagram
-

Visualizing Major Plant Composition with Donut Chart
#Product/Service Introduction #Market and Competitor Analysis #Graph
-

Sales Status by Donut Product Visualization – Attractive Graph Design
#Product/Service Introduction #Market and Competitor Analysis #Graph
