Sales Status by Donut Product Visualization – Attractive Graph Design
RJ0800003_9
- Last Update 07/31/2025
- File Size 0.5MB
- # of Slides 2
- File Format PPTX
- Slide Ratio 16:9
- Color
Keywords
- #Content-Based Slides
- #Design-Based Slides
- #Product/Service Introduction
- #Market and Competitor Analysis
- #Graph
- #Composition
- #Market Share
- #Horizontal Bar
- #Circles
- #Segmented Horizontal Bar
- #Doughnut Chart
- #16:9
- #doughnut chart PowerPoint
- #pie chart slide template
- #sales ratio visualization
- #horizontal bar graph
- #data visualization PowerPoint slide
About the Product
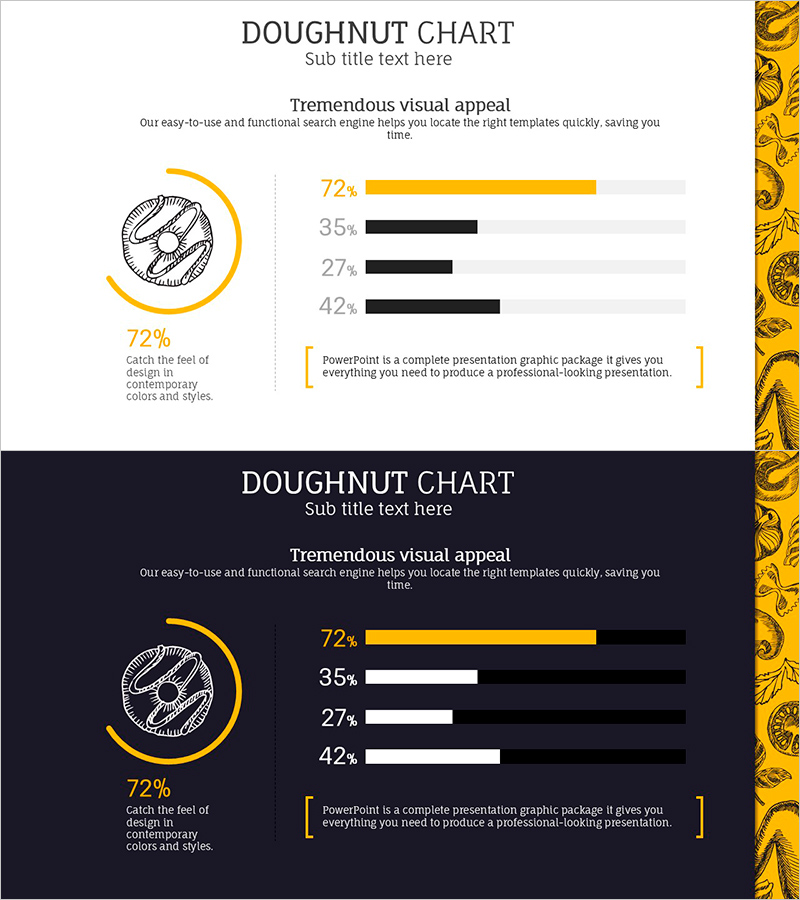
A 2-slide set combining a doughnut chart with a horizontal bar graph. The design uses gold, black, and gray tones to clearly present data, with the left circular doughnut chart emphasizing the key metric (72%) and the right horizontal bar graph comparing four items (72%, 35%, 27%, 42%). Created in 16:9 widescreen format, this PowerPoint presentation is ready to use for corporate presentations, marketing reports, and sales performance analysis.
Usage Points
-
Main Usage
Dual data visualization that emphasizes the proportion of key items against the total using a doughnut chart, while comparing multiple items simultaneously with a horizontal bar graph. Designed to provide at-a-glance understanding of sales status, market share, and product revenue composition.
-
How to Use
On the first slide, modify the center value of the doughnut chart to highlight your key metric. On the second slide, edit the bar lengths and values to add or change comparison items. Keep the color scheme intact and simply replace the data values.
-
Recommended For
Recommended for quarterly sales reports by sales and marketing teams, executive business performance presentations, product-by-product revenue analysis, market share analysis presentations, and financial and planning department reports based on numerical data.
-
Slide Structure
Slide 1: Left doughnut chart (center value 72% emphasized) + right horizontal bar graph (4 items). Slide 2: Same layout with dark background version (black background with white and gold text). Both include title, subtitle, and description text areas.
Related Products
-

The Proportion and Characteristics of Composed Flowers – Engaging Infographic Slide
#Product/Service Introduction #Market and Competitor Analysis #Diagram
-

Doughnut Chart Slide for Crop Growing Items
#Product/Service Introduction #Market and Competitor Analysis #Graph
-

Soccer Match Analysis Chart – Performance Analysis and Future Forecast
#Business Vision and Strategy #Market and Competitor Analysis #Graph
-

Donut-shaped Key Market Analysis Graph – Visualizing Market Share
#Product/Service Introduction #Market and Competitor Analysis #Graph
