Analysis of Drug Efficacy Trends by Year – Data-Driven Business Strategy
RB0400013_6
- Last Update 03/12/2025
- File Size 0.3MB
- # of Slides 2
- File Format PPTX
- Slide Ratio 4:3
- Color
Keywords
About the Product
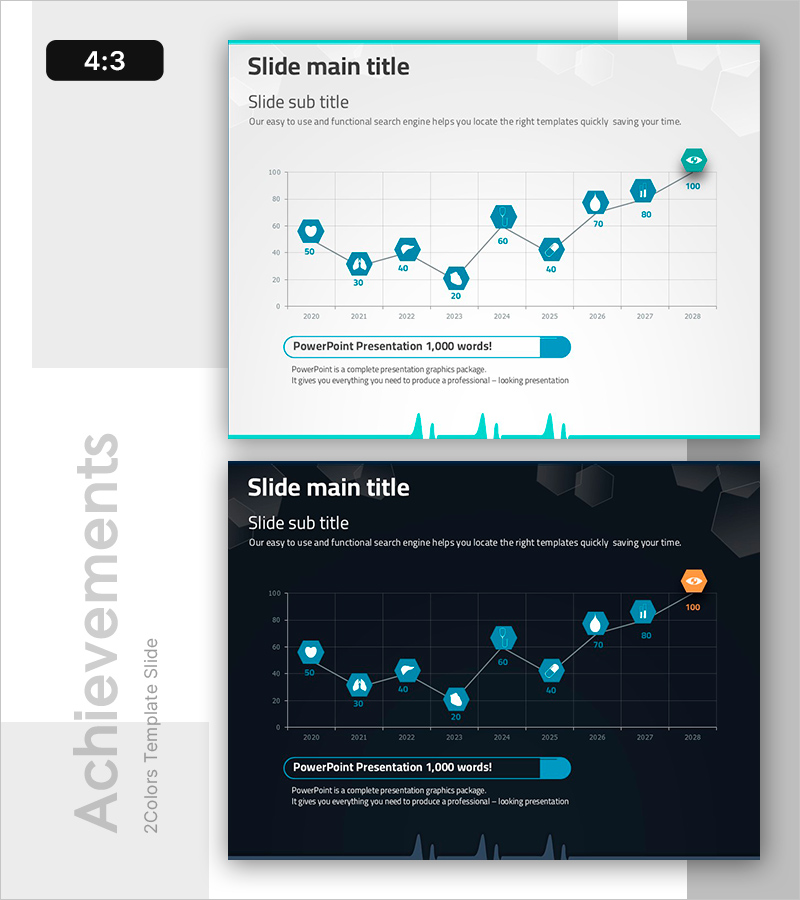
A line chart PowerPoint slide that tracks year-over-year performance changes from 2020 to 2028. Nine data points are marked with teal hexagonal icons and connected by a linear trend line to clearly reveal patterns and trajectories. This presentation template is optimized for analyzing drug efficacy, sales volume, performance metrics, and other time-series data. Two color themes—light background and dark background—are included so you can choose the one that best suits your presentation environment. The PPTX file in 4:3 aspect ratio is ready to edit immediately.
Usage Points
-
Main Usage
Used to intuitively express numerical changes and trends over time. Designed to help audiences quickly grasp long-term data such as drug efficacy analysis, sales performance trends, performance metrics, and market movements at a glance.
-
How to Use
Apply this slide in business reports, performance evaluation presentations, market analysis documents, and business strategy planning sessions. Simply replace the data points and numerical values with your actual figures, and update the title and subtitle to match your context.
-
Recommended For
Ideal for pharmaceutical and chemical industry researchers, marketing and sales professionals, executives preparing reports, consultants, and data analysts. Enhances credibility in any presentation situation where quantitative results need to be emphasized.
-
Slide Structure
Two-slide set. First slide features a light gray background with teal accents; second slide uses a dark navy background with teal accents. Each slide includes a title and subtitle area, a line chart with nine connected data points, a legend box (PowerPoint Presentation 1,000 words!), and a decorative waveform element at the bottom.
Related Products
-

Blue Green Break Line Chart Analysis – Business Strategy and Market Analysis
#Business Strategy #Market and Competitor Analysis #Graph
-

Eco-friendly Business Project Line Graph – Embracing Sustainability
#Business Strategy #Market and Competitor Analysis #Graph
-

War and Broken Line Graph – Market and Competitor Analysis Strategy
#Business Strategy #Market and Competitor Analysis #Graph
-

Trend in the Number of Crimes – Visual Data Analysis
#Business Strategy #Market and Competitor Analysis #Graph
