Graph Analyzing Lung Cancer Treatment Trends – Market Potential and Future Outlook
RJ0800019_20
- Last Update 08/04/2025
- File Size 3.7MB
- # of Slides 2
- File Format PPTX
- Slide Ratio 16:9
- Color
Keywords
- #Content-Based Slides
- #Design-Based Slides
- #Business Strategy
- #Market and Competitor Analysis
- #Graph
- #Achievements
- #Future Outlook
- #Line
- #Line Chart
- #16:9
- #line chart PowerPoint slide
- #multi-series trend analysis
- #healthcare market presentation
- #business performance chart
- #how to create line graph in PowerPoint
About the Product
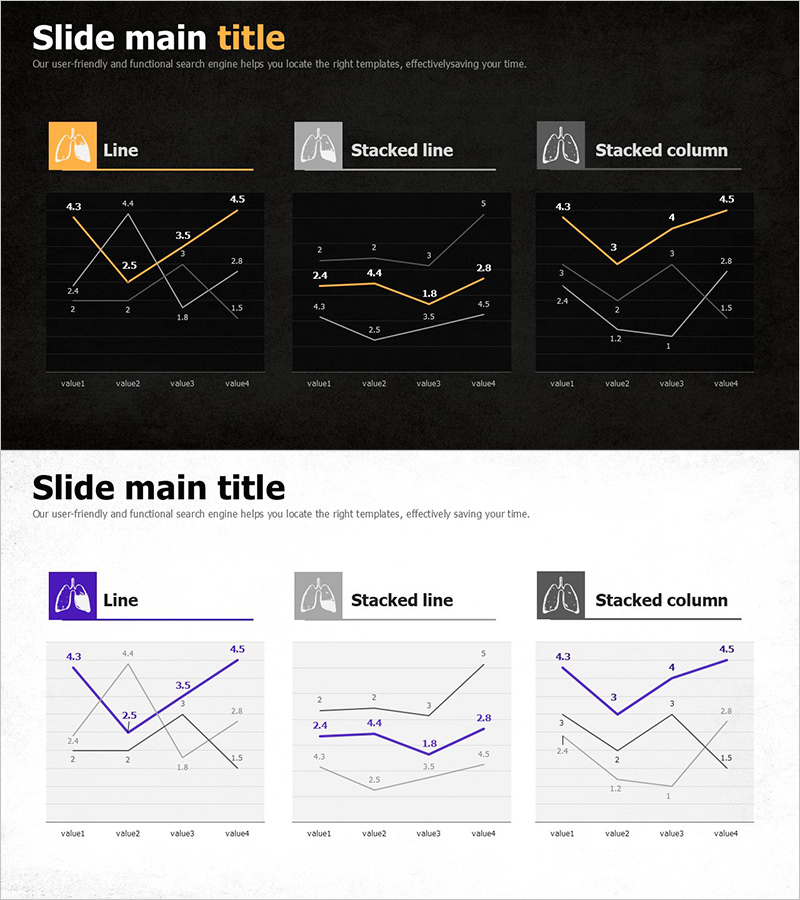
A professional line chart PowerPoint slide designed for healthcare, pharmaceutical market analysis, and business performance reporting. This presentation template visualizes three data series across time periods using orange, gray, and black line colors to clearly distinguish trends and changes. The 2-slide set includes both dark and light background versions, allowing you to choose the design that best fits your presentation environment. Each data point is labeled with numerical values for precise information delivery, and all elements are fully editable for your custom data input.
Usage Points
-
Main Usage
Compares and analyzes multiple data series trends over time simultaneously. Ideal for visualizing healthcare market trends, pharmaceutical treatment outcomes, business performance indicators, and other multi-metric comparisons where rising, falling, and fluctuating patterns need to be displayed together.
-
How to Use
Use the dark background slide for executive meetings and investor presentations, and the light background slide for internal reports and training materials. Replace line colors and numerical values with your own data for immediate presentation use. The 4-point data structure works well for quarterly or annual comparisons.
-
Recommended For
Healthcare and pharmaceutical marketing professionals, business strategy planners, market research analysts, investment presentation speakers, and medical institution performance report managers. Suitable for any business presentation requiring multi-metric comparison and trend visualization.
-
Slide Structure
2-slide set with 3-series line chart design. Each slide features three colored lines (orange, gray, black) connecting 4 data points, with numerical labels at each point. X-axis shows value1 through value4, Y-axis ranges from 0 to 5. Includes legend area and title section for customization.
Related Products
-

Trends in Flower Market Size – Data-Driven Insights
#Business Strategy #Market and Competitor Analysis #Graph
-

Eco-friendly Business Project Line Graph – Embracing Sustainability
#Business Strategy #Market and Competitor Analysis #Graph
-

War and Broken Line Graph – Market and Competitor Analysis Strategy
#Business Strategy #Market and Competitor Analysis #Graph
-

Blue Green Break Line Chart Analysis – Business Strategy and Market Analysis
#Business Strategy #Market and Competitor Analysis #Graph
