Orange Green Rising Numerical Graph – Performance and Future Outlook
RJ0500033_14
- Last Update 06/16/2025
- File Size 1.2MB
- # of Slides 2
- File Format PPTX
- Slide Ratio 16:9
- Color
Keywords
- #Content-Based Slides
- #Design-Based Slides
- #Business Strategy
- #Market and Competitor Analysis
- #Graph
- #Achievements
- #Future Outlook
- #Line
- #Line Chart
- #16:9
- #line chart PowerPoint
- #performance trend slide
- #numerical data visualization
- #rising trend graph
- #4-point data chart
- #PowerPoint graph slide template
About the Product
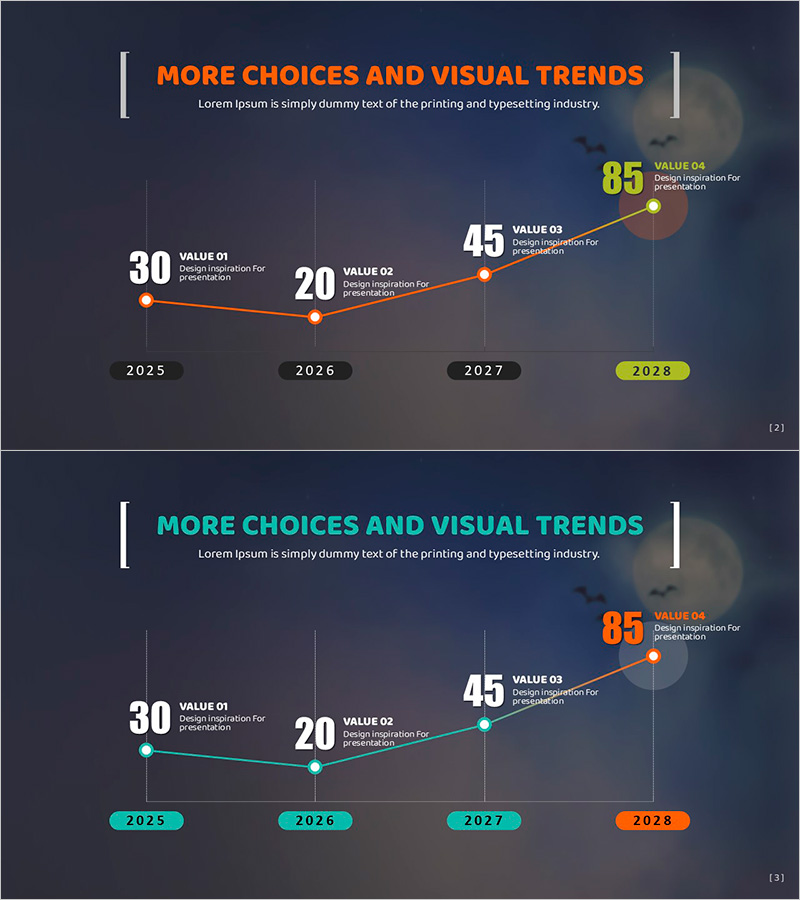
A line chart PowerPoint slide visualizing performance metrics across four time periods using orange and green color schemes. The slide displays numerical progression from 2025 to 2028 with specific data points (30, 20, 45, 85) and corresponding labels at each node. Dark background with orange accent lines and yellow highlight on the final value emphasizes the upward trend, while vertical gridlines clarify the timeline axis. This presentation template effectively communicates performance trajectory, future outlook, and growth projections in business reports and investor presentations.
Usage Points
-
Main Usage
Illustrates annual performance metrics, quarterly revenue trends, project progress rates, and customer satisfaction changes over time. The ascending curve emphasizes positive achievements and future growth projections, making it ideal for demonstrating business momentum and strategic success.
-
How to Use
Insert into performance analysis sections of reports, investor pitch decks, business plan presentations, and marketing campaign effectiveness slides. Easily edit numerical values and labels to reflect actual data, and customize colors to match corporate branding guidelines.
-
Recommended For
Executive briefings, investor relations presentations, sales pitches, performance review meetings, and strategic planning sessions. Suitable for finance managers, marketing teams, project managers, and business consultants presenting data-driven insights and growth narratives.
-
Slide Structure
Two-slide set. First slide features an orange-toned line chart with four data points, vertical gridlines, and year markers. Second slide presents the same structure in teal-cyan tones. Both slides include title area, legend, and data label zones for customization.
Related Products
-

Trend in the Number of Crimes – Visual Data Analysis
#Business Strategy #Market and Competitor Analysis #Graph
-

Blue Green Break Line Chart Analysis – Business Strategy and Market Analysis
#Business Strategy #Market and Competitor Analysis #Graph
-

Analysis of Drug Efficacy Trends by Year – Data-Driven Business Strategy
#Business Strategy #Market and Competitor Analysis #Graph
-

War and Broken Line Graph – Market and Competitor Analysis Strategy
#Business Strategy #Market and Competitor Analysis #Graph
