Blue Green Break Line Chart Analysis – Business Strategy and Market Analysis
RJ0800031_20
- Last Update 08/08/2025
- File Size 1.3MB
- # of Slides 2
- File Format PPTX
- Slide Ratio 16:9
- Color
Keywords
- #Content-Based Slides
- #Design-Based Slides
- #Business Strategy
- #Market and Competitor Analysis
- #Graph
- #Achievements
- #Future Outlook
- #Line
- #Line Chart
- #16:9
- #line chart PowerPoint
- #trend analysis slide
- #business performance PPT
- #market analysis presentation
- #line graph template download
- #how to create line chart in PowerPoint
About the Product
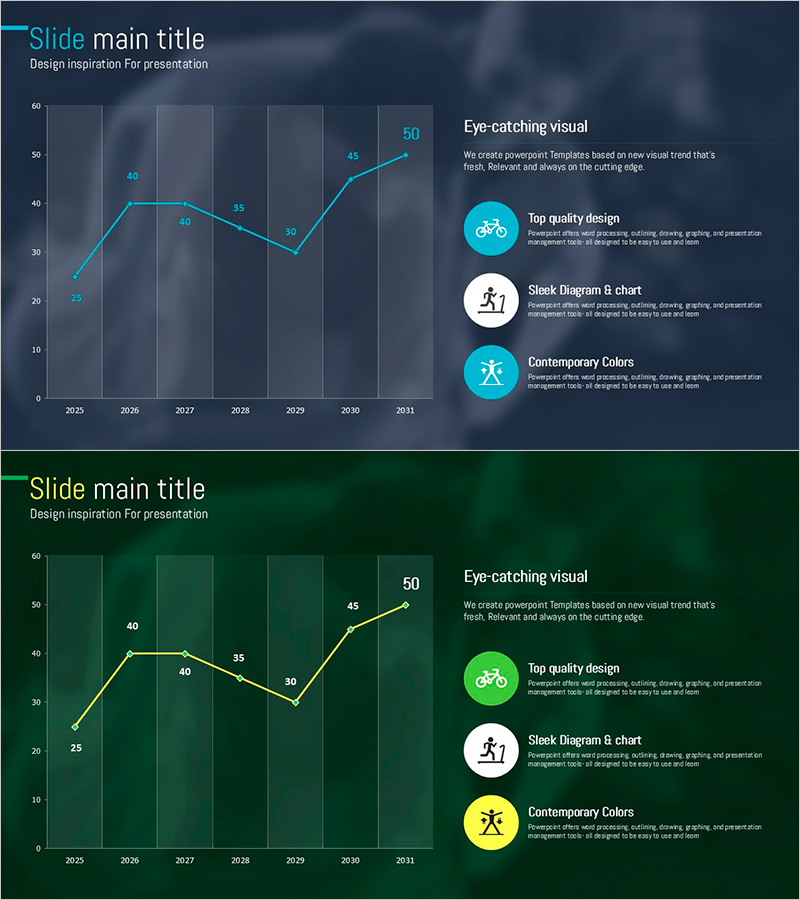
A professional line chart PowerPoint slide visualizing data trends from 2025 to 2031 across eight years. The cyan-colored line on a dark navy background clearly communicates business performance, market analysis, and future outlook. This dual-axis design combines bar graphs with line charts, enabling simultaneous representation of absolute values and trend changes. Three circular icon callouts on the right side emphasize key insights, making it ideal for business reports, sales presentations, and market analysis decks. The slide set includes two variations—one in blue tone and one in green tone—for flexible brand alignment. 16:9 widescreen format, PPTX file type, 2-slide composition.
Usage Points
-
Main Usage
Visualizes year-over-year, monthly, or quarterly numerical trends using line graphs to clearly communicate business performance, revenue changes, and market share fluctuations. The combination with bar graphs allows simultaneous display of absolute values and trend trajectories.
-
How to Use
Insert into the performance analysis section of business reports, market analysis pages of marketing plans, and future outlook slides of investor pitch decks. Directly input data points and figures for real-time updates; adjust colors to match brand guidelines. Compatible with all PowerPoint versions for seamless editing.
-
Recommended For
Finance and planning teams presenting quarterly performance reviews, sales and marketing teams reporting market analysis, executive leadership briefings on business status, and investor presentations demonstrating growth potential. Recommended for all data-driven business presentations requiring trend visualization.
-
Slide Structure
Slide 1: Dark navy background with one cyan line graph, eight data points marked, eight-column bar graph background, and three circular icon callouts (bicycle, sports figure, star icon) on the right for key messaging. Slide 2: Identical structure in green tone variant for color flexibility. Both slides use 16:9 widescreen format ensuring compatibility with modern projectors and displays.
Related Products
-

Trends in Flower Market Size – Data-Driven Insights
#Business Strategy #Market and Competitor Analysis #Graph
-

Analysis of Drug Efficacy Trends by Year – Data-Driven Business Strategy
#Business Strategy #Market and Competitor Analysis #Graph
-

War and Broken Line Graph – Market and Competitor Analysis Strategy
#Business Strategy #Market and Competitor Analysis #Graph
-

Orange Green Rising Numerical Graph – Performance and Future Outlook
#Business Strategy #Market and Competitor Analysis #Graph
